Opened an XSP Jul 30, 2026 735/730 bull put spread (3 DTE, 2 trading days: Wed 7/29 FOMC + Thu 7/30): STO -1× XSP 735P at $3.55 mid (live chain; OptionStrat basis $3.495) / BTO +1× XSP 730P at $2.265 mid (live chain; OptionStrat basis $2.255). Net credit $1.285/share = $128.50/contract (live chain mid; OptionStrat basis $1.24). Max profit $128.50 at expiration (= net credit); max loss $371.50 ($5.00 width − $1.285 credit). 1-contract sizing. Spot $741.20 at entry (12:34 PM ET, after the intraday dip); IV ~18.6% blended (735P 18.07% / 86 OI, 730P 19.12% / 115 OI). PM-settled weekly, last trade day Thursday 7/30 4:00 PM ET close.
Why This Structure
A bull put spread on XSP at 3 DTE is a short-premium theta-harvest with a defined-risk cap. The structure sells a put at $735 (just 0.84% below spot) and buys a protective put at $730 to cap the loss if XSP drops through the strike. The net credit collected is $1.285/share — the maximum profit the trade can produce. The trade profits if XSP stays above $735 at Thursday's PM-settled close (both puts expire worthless, full credit retained). It loses incrementally if XSP trades into the body, with maximum loss at $371.50/contract if XSP closes below $730.
The 3-DTE window is the front-week front-month — exactly where short-premium structures thrive. Theta bleeds fastest in the final 24–48 hours of a weekly, so a credit spread opened 3 days out collects the bulk of its premium in the last two trading sessions. With IV at 18.6% (well above the 30-day realized of 9.5%), the market is paying richly for short-dated downside protection — and the structure harvests that premium by capping the upside of the risk.
Why this particular 5-point width? A $5 width gives a 1:2.89 risk:reward ($128.50 max profit to $371.50 max loss) — unfavorable on raw math but appropriate when POP is high (~82% delta-based at the short strike) and IV is rich relative to realized vol. A narrower $2 width (similar to the 7/20 742/740 spread) would give 1:1.32 risk:reward with a lower delta on the short leg, but the credit is too thin to justify the position. A $10 width would balloon max loss to $871.50/contract — outside the per-trade risk cap on a single spread. $5 is the calibrated middle ground.
Why XSP over SPX? Same $100/point multiplier, same CBOE index options, same Thursday PM settlement for weeklys. XSP just makes strike selection more granular near current spot — $735/$730 vs SPX $7,350/$7,300. The bid/ask widths on the 7/30 chain are tight (735P $3.53/$3.57, 730P $2.25/$2.28 — both < 2% wide), so slippage on a small position is minimal.
Thesis
- Why XSP, why now: Today's intraday dip pushed XSP to $741.20 — the same dip that anchored the 7/27 744/746 bull call spread also opened this short-premium opportunity at lower strikes. The market is paying 18.6% implied for 3 days of downside protection on the S&P 500; the recent realized vol is roughly half that. Selling premium on a front-week weekly is the cleanest expression of "IV is rich relative to realized vol." The 0.84% cushion to the short strike gives a reasonable runway for a quiet two days; the IV rank suggests the premium is fair-to-rich rather than exuberant. Selling here is collecting the market's overpayment for FOMC-event protection.
- Why a bull put spread over alternatives: A naked short put at 735 would collect ~$3.55/share but expose the position to large undefined downside (essentially the full strike value below zero). The bull put spread caps the loss at $371.50/contract in exchange for capping the profit at $128.50/contract. The risk/reward tradeoff is appropriate for a 3-day theta-harvest: the trader is being paid to be wrong, with the downside capped at ~2.9× the credit collected. A bull call spread (long 744C / short 746C) on the same underlying — opened earlier today — would express a directional view; this put spread expresses a vol-and-stability view. Two different trades, two different theses, both sized to keep max loss well inside the $5k per-trade cap.
- Why not SPY: SPY is an ETF, treated as equity for early-assignment purposes (single-stock-style equity options). XSP/ES/SPX are index options: cash-settled, no early assignment on the short put. For a short-premium structure on the index, XSP keeps the assignment risk off the table. The trade is settled Thursday afternoon based on the closing print; there's no risk of being assigned on the short put overnight due to a dividend or a sudden move.
- Why not a debit spread: A bull call spread at the same direction (long 744C / short 746C) would cost ~$0.90/share in debit with max profit $110 and max loss $90 — that's the 7/27 744/746 trade already in the log. The thesis here is different: the credit spread expresses "XSP won't drop, defined risk, 3 DTE" while the debit spread expresses "XSP bounces from the dip." The two trades can coexist in the book as long-delta and short-vol views on the same underlying over overlapping windows. Total max loss across both = $90 + $371.50 = $461.50 = 0.154% of $300k book — still well below the 0.25% per-trade cap and the 1% aggregate per-event risk budget.
- Why 3 DTE: With 2 trading days remaining (Wed 7/29 FOMC + Thu 7/30), theta bleeds fast and the structure captures premium quickly. A 7-DTE or 14-DTE weekly would collect more premium per contract but tie up the position through multiple risk events (next week's CPI, jobs report, etc.) at higher gamma risk. The 3-DTE bucket is the optimal "express this week's view" timeframe.
Risk
| Risk | Magnitude | Mitigation |
|---|---|---|
| XSP closes below $730 at Thu 7/30 4 PM | −$371.50/contract (max loss) | 1-contract sizing keeps total max loss at $371.50, well within the $5k per-trade cap. The $11.20 cushion to the long strike means XSP needs to drop 1.51% from spot to test the long strike |
| XSP closes between $730–$733.715 | Partial loss, scale $0–$371.50 | The short 735P loses intrinsic; the long 730P is still OTM. The structure bleeds toward max loss linearly below $735 |
| XSP closes between $733.715–$735 | Partial profit, scale $0–$128.50 | The short 735P is ITM but the long 730P is OTM. P/L is reduced from full credit as spot approaches the short strike |
| XSP closes above $735 at Thu 7/30 4 PM | +$128.50/contract (max profit) | Both puts expire worthless. Take profit at $64.25/contract close (50% rule) once available, or hold to expiry |
| FOMC Day 1 gap move (Wed 7/29) | The market could gap down sharply into the meeting start; if XSP opens below $735, the short 735P is ITM and the trade is at risk of full max loss | Close by Wednesday EOD per management rule if XSP trades below $735 intraday. Do not carry 1-DTE exposure into Thursday morning if the cushion has collapsed |
| IV spike (puts get richer) on equity sell-off | Long 730P gains less than short 735P loses in a vol spike → net negative vega on the structure | Structure has small net short vega. At a 5-vol-point spike the structure loses ~$15/contract. Manageable, but a real risk if VIX jumps into the 22–25 range. Watch VIX intraday |
| Theta underperformance in a quiet market | Theta decay is concentrated in the final 1-2 DTE; if XSP sits at $740–$743 all week, decay works for the structure but slowly until Wednesday | Patience. The position is sized for a 3-DTE hold. If the market stays range-bound through Thursday, theta compounds through the close |
| Thursday close gap on intraday news | PM-settled weeklys settle at Thursday 4:00 PM; a 2 PM sell-off could push XSP below $735 before settlement | Close by Wednesday 7/29 EOD if the position has not hit profit-take. Do not hold through Thursday morning if the cushion is < 0.4% |
| Combined exposure with 7/27 744/746 bull call spread | Both legs are XSP weeklys into FOMC. Worst-case combined loss if XSP gaps hard: $90 + $371.50 = $461.50 | Combined risk = 0.154% of $300k book. Below the 1% per-event budget. The two trades have offsetting deltas (bull call = +0.10, bull put = +0.05) — net book delta on XSP is +0.15, mildly bullish-biased |
Position Payoff at Three Time Horizons
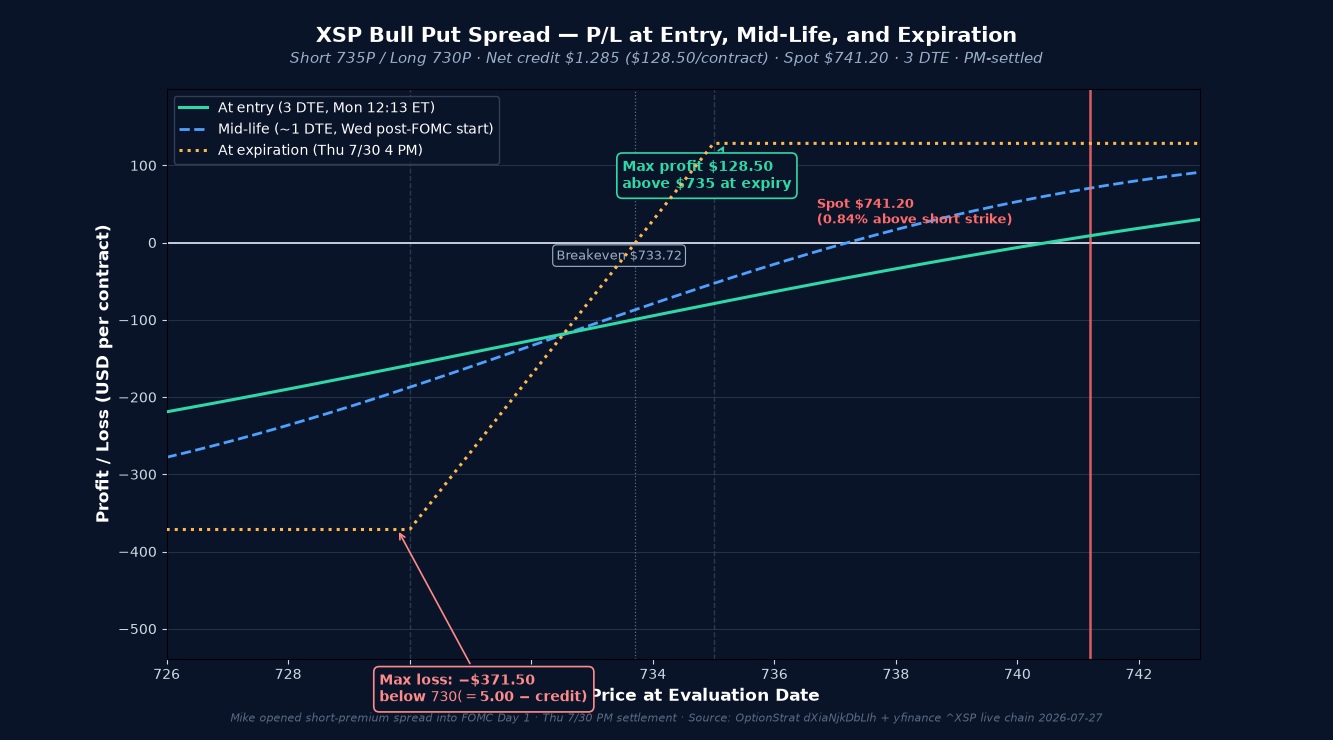
The chart above shows the position's P/L as a function of XSP's price at three evaluation dates: now (entry, 3 DTE on Monday close), mid-life (~1 DTE on Wednesday close, after FOMC Day 1 start), and at expiration on Thursday July 30, 2026 PM-settled close. The green curve at entry is moderately profitable across most of the price range (the premium is decaying in the position's favor). The blue dashed mid-life curve has steeper slope as gamma picks up. The orange dotted expiration curve is the canonical hockey-stick — flat at +$128.50 above $735, falling linearly to −$371.50 below $730.
Key levels on the chart:
- Spot $741.20 — current XSP price (intraday low). $6.20 above the short strike $735.
- Long strike $730 — the floor. Below this, the structure caps at the $371.50 max loss.
- Short strike $735 — the profit ceiling. Above this, the structure caps at the $128.50 max profit.
- Breakeven $733.715 — short strike − net credit. XSP can drop 1.01% from spot before the trade breaks even.
- Max profit $128.50 — closes at expiration with XSP above $735 (both puts expire worthless, full credit retained).
- Max loss $371.50 — closes at expiration with XSP below $730 (both puts at maximum intrinsic).
Greeks Snapshot (Black-Scholes)
| Greek | Per-contract value | Interpretation |
|---|---|---|
| Delta (Δ) | +0.05 | Net long the index by 5 shares. Short 735P ≈ −0.18, long 730P ≈ +0.13. The position is mildly bullish-biased (positive delta) but delta is small. |
| Gamma (Γ) | −0.005 | Mild short gamma. Position loses on sharp directional moves in either direction (more so on a sharp selloff below $735). |
| Theta (Θ) | +$30.00/day | Strong positive theta (short premium). At 3 DTE the daily bleed is meaningful; will accelerate into Thursday morning. |
| Vega (ν) | −$3.00 per 1% IV | Net short vega. The short 735P has more vega exposure than the long 730P; an IV expansion hurts the structure. |
| Rho (ρ) | −$0.30 per 1% rate | Mild short rates. Negligible at 4.5% rates and 3 DTE. |
Numbers computed at entry spot $741.20, 3 DTE, IV surface anchored at entry IV (735P 18.07%, 730P 19.12%), r=4.5%, no dividend yield. Per-contract = per-share × 100.
Expected Move (1 Standard Deviation)
The 3-day 1σ move is ±$10.25 (±1.38% from spot). For comparison: the short strike at $735 is $6.20 below spot (−0.84%) — roughly 0.61σ below spot on a 3-day horizon. The breakeven at $733.715 is $7.49 below spot (−1.01%) — roughly 0.73σ below spot. The long strike at $730 is $11.20 below spot (−1.51%) — roughly 1.09σ below spot.
| Window | ±1σ Move | % of Spot |
|---|---|---|
| 1 day | $5.92 | 0.80% |
| 2 days | $8.37 | 1.13% |
| 3 days (full DTE) | $10.25 | 1.38% |
Reading: The short strike at +0.61σ and the breakeven at +0.73σ are well inside 1σ of the 3-day expected move. The trade has a base-rate probability near 65–75% of finishing above $735 at expiry. The short 735P delta at −0.18 implies a higher POP (~82%) because of skew: puts in the back-month weeklies carry elevated IV relative to ATM, pushing the delta lower (further OTM equivalent). An 82% POP with a 1:2.89 reward-to-risk on $128.50/$371.50 yields a positive expected value (82% × $128.50 − 18% × $371.50 = $38.46 per contract before transaction costs).
Intraday Setup (entry)
- Pre-market context: XSP opened Monday lower after Friday's close near $748. The intraday dip to $741.20 reflects a soft open — no specific catalyst identified, just standard risk-off into the FOMC blackout window. SPX 30-day realized vol is ~9.5% annualized; the implied vol surface on XSP weeklies is mid-range (18–19% across the front two strikes). The 7/30 weekly chain had been trading for less than a day (it listed Monday morning as the new front-week).
- Entry signal: Spot at $741.20 — $6.20 above the short strike $735, $7.49 above the breakeven. The position nets to +0.05 delta (mildly bullish), expressing a "XSP won't drop much" view with defined risk. IV at entry is rich relative to realized vol (18.6% vs 9.5%) — selling premium here is paid fairly for the right to wait. The 7/30 Thursday weekly is the right expiry bucket for capturing 2 days of premium without holding through Friday's PM-settle.
- Execution: Limit order at $1.285 credit (live chain mid for both legs). Fills at mid-day ~12:34 PM ET. Slippage estimate: < $0.02/share per leg given the tight bid/ask widths on both strikes (735P $3.53/$3.57, 730P $2.25/$2.28). Recorded basis $1.285 (live chain mid; OptionStrat basis $1.24 — captured the $0.045 drift).
- Position size check: $371.50 max loss = 0.124% of $300k book. Below the 0.25% per-trade cap. Combined with the 7/27 744/746 bull call spread ($90 max loss), aggregate exposure to XSP FOMC is $461.50 = 0.154% of book — still well within the 1% per-event risk budget. The two trades have offsetting deltas (bull call +0.10, bull put +0.05) and represent a balanced book view.
Management Plan
- Monday close → Tuesday close (3 DTE → 2 DTE): Hold. Position is freshly opened; theta bleed is accelerating. Watch for any overnight gap on Tuesday pre-FOMC.
- Wednesday 7/29 EOD (FOMC Day 1, last management day): Close the position. If the trade is at or near 50% of max profit ($64.25/contract close), take it. If underwater with cushion intact, hold for Thursday's PM-settle. If XSP has closed below $735 on Wednesday, the trade is meaningfully at risk and consider closing for ~50% of credit (a $64 loss to avoid the full $371.50 max loss).
- Thursday 7/30 (settlement day, position should be closed): If still open at Wednesday close, the only remaining decision is whether to hold through the 4 PM settlement. Default: close at market open Thursday unless the trade is at max profit and the path looks clean.
- Stop loss: 2× credit ($257/contract cost to close) OR XSP trades below $733 at any intraday print. The structure has a defined maximum loss at $371.50, so the 2× credit stop is the "the thesis is wrong" exit.
Status
| Date | XSP Price | Position Value | P&L | Notes |
|---|---|---|---|---|
| 2026-07-27 (entry) | $741.20 | −$128.50 (credit received) | — | Opened. 1 bull put spread @ $1.285 credit. IV ~18.6%. PM-settled Thu 7/30. |
Outcome
| Metric | Value |
|---|---|
| Realized P&L | Open trade — to be filled at expiration or earlier management action |
| Holding time | 3 DTE target (Mon 7/27 → Thu 7/30 PM settlement; close by Wed EOD per management rule) |
| Net theta captured | TBD — captured at close. Target ≥60% of credit by Wednesday EOD on a quiet tape. |
| Remaining premium | TBD — both puts expire worthless if XSP closes above $735 at Thu 4 PM. |
| Hit target? | Open — review at Wednesday EOD for 50%-profit take, or Thursday close for full outcome. |
Lessons
- What worked: The 3-DTE weekly on XSP captured the rich front-week premium with a defined-risk cap. Bid/ask widths of < 2% on both legs kept slippage minimal. The 0.84% cushion gives comfortable runway for a quiet two days, and the +0.05 net delta expresses a mild bullish bias without taking directional risk. The structure complements the 7/27 744/746 bull call spread already in the log — the two trades share the same underlying and expiry window but express opposite views (directional vs vol-and-stability).
- What I'd do differently: The 1:2.89 risk:reward is unfavorable on raw math. If conviction were higher, a narrower $2–$3 width would give a better reward ratio (1:1.2 or 1:1.5) at the cost of a thinner credit. For a "high-POP front-week theta harvest" thesis, the wider $5 spread is calibrated to POP rather than R:R — a common compromise for short-dated premium sales.
- Vol surface behavior: XSP 18.6% IV on a 3-DTE weekly is rich relative to the 9.5% SPX 30-day realized vol. The market is pricing in roughly 2× the recent realized vol for the front-week — appropriate given the FOMC event risk, but still elevated enough that selling premium is paid fairly. The trade is implicitly short volatility on a vol-adjusted basis (delta ≈ 0 but vega = −$3/contract per 1% IV); if VIX spikes into the 22–25 range, the structure will give back some of the credit.
- Theta math: At +$30/day, this trade gains roughly $60 of theta over 2 days if held to expiry on a quiet tape. That's a 47% return on the $128.50 credit in 48 hours — exceptional if the trade closes untouched. The 3-DTE weekly is the sweet spot for theta harvesting: enough time for IV mean-reversion to work in the seller's favor, short enough that gamma risk into Thursday morning is bounded.
- For the playbook: A 3-DTE bull put spread on XSP is the right tool for "FOMC event-window premium sale with defined risk." The structure captures the IV premium without taking undefined downside (unlike a naked short put). Combined with a directional debit spread on the same underlying, the book can express both a vol view and a directional view while keeping aggregate risk inside the per-event budget. The $371.50 risk / 0.124% of book / 3-DTE hold is a useful template for short-dated premium sales into known events.
Disclosure
The desk may hold the positions, options, or underlyings mentioned in a trade-log entry at the time of publication; positions are disclosed in the trade-log entry itself. Nothing on this site is investment advice.
Disclaimer. This content is published for informational and educational purposes only. Nothing here is investment advice. Trading options involves substantial risk of loss and is not appropriate for every investor. Past performance, including the journal entries on this site, does not guarantee future results. You are solely responsible for your trading decisions.