Opened a QQQ $800 calendar call spread at 18-month duration — short the Dec 17 '27 800C, long the Jan 21 '28 800C — on continued NASDAQ weakness. Opened July 24, 2026, 11:58 AM ET at $3.80 debit ($380 total; 1 calendar spread). Defined-risk, long-duration theta position; estimated max profit ~$2,556.06 if QQQ reclaims $800 by the Dec 17 '27 front expiry, max loss $380 (= debit). Profit zone approximately $785–$815 at front expiry. Spot $691.70 at entry; IV ~28% (front 29.1%, back 29.5% — slightly back-rich). Pairs with the $850 calendar opened separately.
Why This Structure
The calendar call spread is a defined-risk theta-harvest structure: short a nearer-dated call, long a further-dated call at the same strike. The front short leg decays faster than the back long leg, so the spread gains value as time passes — provided the underlying drifts toward the strike.
Why an 18-month calendar? Standard calendars run 30–90 days on the short leg. This trade runs 511 DTE on the short leg — a non-standard duration bucket with different mechanics: very slow theta, large back-month residual time value at front expiry, a deeper OTM strike, and a longer event window. The desk is expressing a slow-grind recovery thesis: QQQ doesn't need to snap back to $800 this quarter; it needs to get there by December 2027.
Why the $800 strike? $800 is the round-number magnet — roughly 15.7% above the $691.70 entry spot, and the level QQQ traded at before the recent weakness. The calendar's estimated ~$2,556 max profit concentrates exactly there at the Dec 17 '27 front expiry.
Why 35 days between legs? The Dec 17 '27 → Jan 21 '28 gap (511 DTE front / 546 DTE back) leaves the back leg with enormous residual time value when the front expires — the calendar's second profit engine. If QQQ hasn't reached $800 by December 2027, the back long leg still holds substantial value and the structure can be rolled.
Thesis
- Slow-grind recovery to a magnet level: QQQ at $691.70 on continued NASDAQ weakness. $800 is the pre-weakness level and the natural 18-month magnet. The calendar doesn't need velocity — it needs QQQ to drift 15.7% higher over 17 months and then sit still.
- Back-rich term structure: IV is 29.1% on the front leg and 29.5% on the back — slightly back-rich. The calendar buys the back leg's extra volatility cheaply relative to the front premium it sells, a favorable term-structure setup for a long-duration calendar.
- Two ways to win: If QQQ reclaims $800 by Dec 17 '27, the front short expires worthless against a still-valuable back long — the ~$2,556 peak. If QQQ is still depressed, the back leg's large residual time value plus the front leg's decay still leaves salvage value; the structure can be rolled into 2028.
- Defined risk on an index with event risk: 511 DTE spans multiple FOMC cycles, earnings seasons, and a midterm election. The calendar's max loss is the $380 debit — no matter how far QQQ runs, the long back leg caps the damage.
Risk
| Risk | Magnitude | Mitigation |
|---|---|---|
| QQQ stays below ~$785 at Dec 17 '27 expiry | Partial to full loss of the $380 debit | Close 90 days before short expiry; roll the back leg if the recovery thesis is intact |
| QQQ rips above ~$815–$820 before Dec 17 '27 | Calendar loses value as both legs go deep ITM and the spread compresses | Stop at $760 cost to close (2× debit); the long back leg caps the loss |
| QQQ below $620 at any point | Recovery thesis broken | Hard stop: close the structure if QQQ closes below $620 |
| IV regime shift | A volatility spike inflates both legs; a crush deflates the back leg's residual value | Slightly back-rich entry gives a small cushion; defined risk caps the damage |
| Event gaps over 17 months | Multiple FOMC meetings, earnings seasons, midterms | Defined risk: max loss $380 regardless of gap size |
Position Payoff at Three Time Horizons
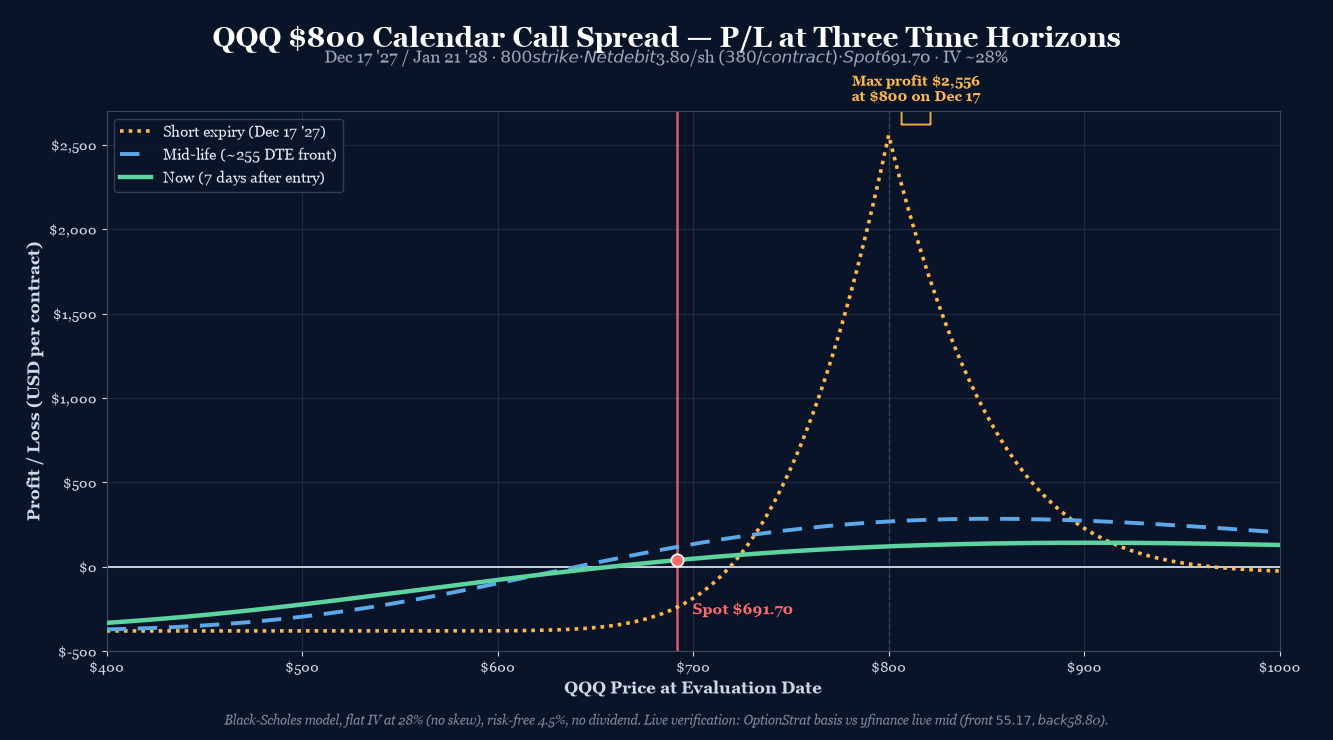
The chart shows the P/L curve at three time horizons. The calendar's signature tent shape peaks at the $800 strike at the front (Dec 17 '27) expiry — the estimated ~$2,556.06 max profit if QQQ closes exactly at $800 on Dec 17, 2027. The profit zone is approximately $785–$815 (described elsewhere in the source as ~$785–$820) — a precision structure, not a wide-net structure. Because the duration is so long, the tent sharpens very slowly; the back leg's residual value is a substantial floor under the position for most of the hold.
Key levels on the chart:
- Spot $691.70 — current underlying price, 15.7% below the strike.
- Strike $800.00 — both legs; the calendar's peak at front expiry.
- Max profit ~$2,556.06 — at $800 on Dec 17, 2027 (BSM estimate).
- Max loss $380 — the net debit, realized if QQQ is far from $800 at front expiry.
- Profit zone ~$785–$815 — approximate breakeven band at front expiry (source estimate; also described as ~$785–$820).
Paired Position: Combined P/L at Front-Expiry
This trade pairs with a separate $850 calendar call spread (not in scope for this migration; its page is referenced in the source as a companion trade). The source's combined-payoff analysis gives these figures, preserved here in text (the comparison chart itself was not migrated):
- The $800 calendar peaks at $800; the $850 calendar peaks at $850.
- Combined peak value: ~$3,683 at $849 at front expiry.
- Combined max loss: $701 (both debits).
- The pair expresses a bracketed recovery view: QQQ reclaiming either $800 or $850 by December 2027 pays the combined peak; the $849 combined-peak level reflects the overlap of the two tents.
Trade Details
| Field | Value |
|---|---|
| Instrument | QQQ options (Dec 17 2027 / Jan 21 2028) |
| Underlying | QQQ (Invesco QQQ Trust, Nasdaq-100 ETF) |
| Structure | Calendar Call Spread — 2 legs, same strike, 18-month duration |
| Strikes | $800 / $800 |
| Leg 1 | STO −1× QQQ 800C Dec 17, 2027 at $54.95 (live mid $55.17; IV 29.1%) |
| Leg 2 | BTO +1× QQQ 800C Jan 21, 2028 at $58.75 (live mid $58.80; IV 29.5%) |
| Calendar width | 35 days (511 DTE front / 546 DTE back) |
| Expiration (front) | 2027-12-17 (511 DTE at entry) |
| Expiration (back) | 2028-01-21 (546 DTE at entry) |
| Net debit at fill | $3.80/share = $380/contract (recorded basis) |
| Live net debit | $3.63/share = $363/contract (live-mid cross-check; $17/contract saved vs recorded basis) |
| Contracts | 1 calendar spread |
| Total debit | $380 (recorded basis) |
| Max profit | ~$2,556.06 at $800 on Dec 17, 2027 (BSM estimate) |
| Max loss | $380 (= net debit, defined risk) |
| Profit zone | ~$785–$815 at front expiry (approximate; also described as ~$785–$820) |
| Reward:risk | ~6.7:1 ($380 risk to ~$2,556 reward) |
| IV at entry | Front 29.1%, back 29.5% (~28%; slightly back-rich) |
| Entry time | Jul 24 2026, 11:58 AM ET |
| Management rule | Take profit at $1,278 (50% of estimated max profit) OR close 90 days before short expiry |
| Stop loss | $760 cost to close (2× debit) OR QQQ closes below $620 |
Greeks Snapshot (Black-Scholes)
| Greek | Interpretation |
|---|---|
| Delta (Δ) | Near-zero at entry with spot far below the strike; delta grows as QQQ approaches $800. |
| Gamma (Γ) | Long gamma near the strike at front expiry — the tent's peak is a gamma concentration. |
| Theta (Θ) | Net positive but very slow — 511 DTE means daily decay is a trickle, not a stream. Time is the edge, but a patient one. |
| Vega (ν) | Large gross vega on both legs given the duration; net positioning slightly long back-month vol (back-rich entry). |
Numbers per-contract = per-share × 100.
Verification (anti-pattern #80: basis vs live)
Live verification against the chain at entry:
| Leg | Recorded basis | Live mid |
|---|---|---|
| Short Dec 800C | $54.95 | $55.17 |
| Long Jan 800C | $58.75 | $58.80 |
| Net debit | $3.80/share ($380) | $3.63/share ($363) |
The live chain was $0.17/share tighter than the recorded basis — a $17/contract saving. The source records the $3.80 basis for the hero numbers; the live economics are modestly better.
How the Trade Has Moved Against the Underlying
The source includes a companion spot-vs-strategy-premium simulation chart (not migrated; only the P/L curve was in scope). Its key reading: the calendar's premium is a wide, slow-forming tent centered on $800 — the structure gains value as QQQ grinds toward the strike over the 17-month window and loses value on sharp moves away from it. With spot starting at $691.70, the position needs a sustained 15.7% recovery rally to reach its peak; the long duration makes the path matter less than the destination.
Intraday Setup (entry)
- Pre-market context: Continued NASDAQ weakness; spot $691.70 at entry. IV ~28% with the back month slightly richer than the front — a favorable term-structure setup for the calendar.
- Entry signal: The $800 strike sits 15.7% above spot — the pre-weakness level and the natural 18-month magnet. The 35-day calendar width leaves the back leg with large residual value at front expiry.
- Execution: Opened July 24, 2026, 11:58 AM ET at $3.80 debit (recorded basis). Live-mid cross-check: $3.63 — the actual fill economics were ~$17/contract better than the recorded basis.
- Position size check: $380 max loss = 0.127% of $300k book. Below the per-trade cap. (Combined with the $850 calendar, the pair risks $701.)
Management Plan
- Profit target: $1,278 — 50% of the ~$2,556 estimated max profit. Take it if the calendar's mark reaches the target; long-duration calendars rarely need to be held to the exact peak.
- Time stop: Close 90 days before the short leg's expiry (around mid-September 2027) regardless of P&L. Never hold a short front leg into its final quarter on a 17-month position.
- Stop loss: $760 cost to close (2× the debit) OR QQQ closes below $620 — the recovery thesis is broken at that level.
- Adjustment: If QQQ approaches $800 well before December 2027, consider taking the profit early. If QQQ is still depressed in late summer 2027, roll the structure or close for the back leg's residual value.
Position Update Log
| Date | QQQ Price | Position Value | P&L | Notes |
|---|---|---|---|---|
| 2026-07-24 (entry) | $691.70 | $380.00 | — | Opened. 1 calendar call spread @ $3.80 debit. IV ~28%. |
Outcome
| Metric | Value |
|---|---|
| Realized P&L | Open trade — to be filled at front expiry or earlier management action |
| Holding time | 511 DTE target on the short leg (Jul 24 2026 → Dec 17 2027) |
| Hit target? | Open — take profit at $1,278; time stop 90 days before short expiry. |
Lessons
(To be filled in as the trade progresses through Q3/Q4 2027.)
- For the playbook: An 18-month calendar is a non-standard duration bucket. The playbook's calendar section calibrates calendars at 30 DTE on the short leg; this trade is 511 DTE on the short leg. Different mechanics: very slow theta, large back-month residual time value at front expiry, deeper OTM strike typical, longer event window. A future playbook entry on long-duration calendars (180+ DTE short) would be useful, especially around strike selection and IV considerations.
Cross-references
- The $850 calendar call spread (companion trade, not in scope) pairs with this $800 calendar to express a bracketed recovery view; combined peak ~$3,683 at $849, combined max loss $701.
Disclosure
The desk may hold the positions, options, or underlyings mentioned in a trade-log entry at the time of publication; positions are disclosed in the trade-log entry itself. Nothing on this site is investment advice.
Disclaimer. This content is published for informational and educational purposes only. Nothing here is investment advice. Trading options involves substantial risk of loss and is not appropriate for every investor. Past performance, including the journal entries on this site, does not guarantee future results. You are solely responsible for your trading decisions.