Opened a second RSP ETF Jan 21 2028 220/230/280/285 long call condor (548 DTE) — an asymmetric, "short upper" structure with a $10-wide lower body and a $5-wide upper body. Net debit $3.175/share ($317.50/contract), identical to RSP #1, but the tightened upper wing turns a $317.50 max loss above $290 into a permanent $182.50 upside plateau above $287. Lower breakeven $223.18; no upper breakeven. The trade strictly dominates RSP #1 above $287. Filled at 12:55 PM ET, ~8 minutes after RSP #1. Spot $212.40 at entry (down $0.05 from the RSP #1 fill).
Why This Structure
This is the asymmetric sibling of RSP #1 (the 220/230/280/290 long call condor shipped earlier today). Same four-strike template, but the upper long wing moves in from 290 to 285 — a $5-wide upper body instead of $10-wide.
The effect: the upper wing costs more ($1.175 vs $1.075), but the upper body short collects more premium relative to the wing width. Net debit stays $3.175/share — the same as RSP #1 — but the payoff above $287 flips from a $317.50 max loss to a permanent $182.50 plateau. RSP #2 is strictly better than RSP #1 everywhere above $287.
The structure is: pay $3.175 to own the right to be paid $6.825 if RSP closes anywhere between $230 and $280 at expiry 18 months from now, with a $182.50 consolation plateau if RSP closes above $287. The only true risk is a close below $220 ($317.50 max loss).
The comparison against RSP #1 is deliberate and immediate. The two trades shipped within 8 minutes of each other, with the same debit, on the same underlying and expiry. This is not a different trade — it's the same trade with a cheaper upper wing.
Direct Comparison to RSP #1
| Metric | RSP #1 (220/230/280/290) | RSP #2 (220/230/280/285) |
|---|---|---|
| Upper long wing | 290C @ $1.075 | 285C @ $1.175 |
| Upper body width | $10 | $5 |
| Net debit | $3.175 | $3.175 (same) |
| Max profit | $682.50 | $682.50 (same) |
| Max loss (lower) | $317.50 below $220 | $317.50 below $220 (same) |
| Max loss (upper) | $317.50 above $290 | $182.50 profit plateau above $287 |
| Upper breakeven | $286.82 | None (permanent plateau) |
Thesis
- Why the tighter upper wing: If the breakout thesis (RSP above $290) is the only scenario where RSP #1 loses its full debit, and a runaway breakout to $290+ over 18 months is the least likely regime path, then paying $0.10/share more for the 285C wing to convert that loss into a $182.50 plateau is cheap insurance. The trade's only true risk becomes a close below $220 — a 3.7% decline from entry spot.
- Why same debit is the headline: The market is telling us something. The 285C wing at $1.175 is only $0.10 more than the 290C at $1.075, but it buys $5 of strike coverage. The upper body short 280C at $2.20 offsets most of the wing cost. The net result: identical debit, strictly better payoff above $287. When the vol surface hands you a free asymmetry, take it.
- Why open both, not just RSP #2: The two trades together express a bracketed view with a skew. RSP #1 covers the "flat tape" base case with a wide upper profit zone. RSP #2 covers the same base case but harvests the breakout tail. Together they're a $635 position with a combined max profit of $1,365 in the $230–$280 zone.
Risk
| Risk | Magnitude | Mitigation |
|---|---|---|
| RSP closes below $220 at expiry | Full $317.50 loss | Stop at $205 close; the long 220C loses intrinsic as the underlying drops |
| RSP closes between $220–$223.18 | Partial loss, scale $0–$317.50 | Hold; the 220C still has time value at expiry only if ITM |
| RSP closes between $223.18–$230 | Partial profit, scale $0–$682.50 | Hold for max profit at expiry |
| RSP closes between $230–$280 | $682.50 max profit (capped) | Take 50% at $341 close once the trade crosses 50% profit |
| RSP closes between $280–$285 | Partial profit, scale $0–$682.50 | Hold; the upper body still captures time premium |
| RSP closes above $285 | $182.50 plateau (permanent) | Hold to expiry; the plateau is the floor |
| Scenario 7: realized vol < 11% holds | Condor benefits (theta positive) | Favorable |
| Scenario 8: realized vol expands > 25% | Wings gain more than body loses — net positive | Acceptable |
| Scenario 9: low liquidity (TIER 3 ETF) | Bid/ask widths: 220C $4.00 (372%), 230C $2.80 (260%), 280C $2.40 (223%), 285C ~$0.95 (est.) | Use limit orders; wide spread already factored into debit |
Position Payoff at Expiration
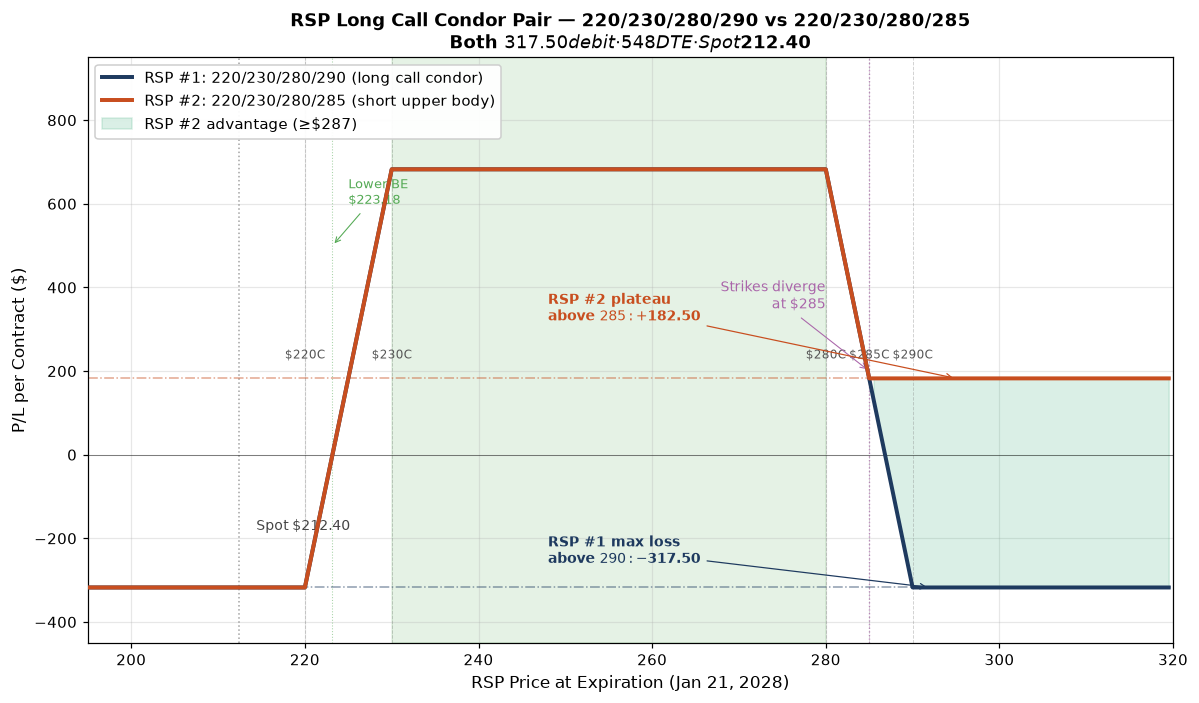
The chart compares RSP #2 (220/230/280/285) against RSP #1 (220/230/280/290) at the Jan 21, 2028 expiration. Below $285, the two structures are identical — same debit, same max profit, same loss below $220. Above $287, RSP #2 settles at a permanent $182.50 profit plateau while RSP #1 decays to a $317.50 max loss at $290.
Key levels on the chart:
- Spot $212.40 — current underlying price.
- Lower long strike $220.00 — the floor; below this, the structure loses intrinsic value.
- Lower short strike $230.00 — lower profit boundary.
- Upper short strike $280.00 — upper profit boundary.
- Upper long strike $285.00 — the new ceiling; above this, the structure locks in the $182.50 plateau.
- Lower breakeven $223.18 — long strike + net debit. There is no upper breakeven.
- Max profit $682.50 — closes at expiration with RSP between $230 and $280.
- Max loss $317.50 — closes at expiration with RSP below $220 only.
- Upside plateau $182.50 — closes at expiration with RSP above $287.
Trade Details
| Field | Value |
|---|---|
| Instrument | RSP ETF options (Jan 21 2028 LEAP) |
| Underlying | RSP (Invesco S&P 500 Equal Weight ETF) |
| Structure | Long Call Condor, short upper wing — 4 legs (long the wings, short the body) |
| Strikes | Long 220C / Short 230C / Short 280C / Long 285C (all calls) |
| Leg 1 | BTO +1× RSP 220C Jan 21, 2028 at $18.50 (OptionStrat basis; live chain mid $18.50) |
| Leg 2 | STO -1× RSP 230C Jan 21, 2028 at $14.30 (OptionStrat basis; live chain mid $14.30) |
| Leg 3 | STO -1× RSP 280C Jan 21, 2028 at $2.20 (OptionStrat basis; live chain mid $2.20) |
| Leg 4 | BTO +1× RSP 285C Jan 21, 2028 at $1.175 (OptionStrat basis; live chain mid $1.175) |
| Width | $10.00 lower body + $5.00 upper body |
| Expiration | 2028-01-21 (548 DTE at entry) |
| Settlement | AM-settled (standard monthly LEAP, last trade day Thursday 1/20) |
| Net debit at fill | $3.175/share = $317.50/contract (OptionStrat basis; live chain mid $3.18) |
| Contracts | 1 long call condor |
| Total debit | $317.50 (1 × $317.50) |
| Max profit zone | RSP between $230 and $280 at Jan 21, 2028 AM settlement |
| Max profit | $682.50 at expiration |
| Max loss | $317.50 (= net debit, below $220 only) |
| Lower breakeven | $223.18 (long strike $220 + net debit $3.175) |
| Upper breakeven | None — permanent $182.50 plateau above $287 |
| IV at entry | ~22% across strikes (live chain: 220C 22.8%, 230C 21.7%, 280C 19.2%, 285C 18.0% est.) |
| Realized vol (30d) | ~11.7% annualized |
| Net delta (structure) | Near zero (balanced 4-leg) |
| Entry time | Jul 22 2026, 12:55 PM ET (8 minutes after RSP #1) |
| Management rule | 50% of max profit ($341 to close) OR close at 90 DTE |
| Stop loss | 2× debit ($635/contract cost to close) OR RSP closes below $205 |
Greeks Snapshot (Black-Scholes)
| Greek | Per-contract value | Interpretation |
|---|---|---|
| Delta (Δ) | +0.00 | Near-zero net delta. Long 220C ≈ +0.83, short 230C ≈ −0.79, long 285C ≈ +0.10, short 280C ≈ −0.11. The legs roughly cancel — a delta-neutral structure. |
| Gamma (Γ) | −0.008 | Mild short gamma from the body dominates long gamma from the wings. |
| Theta (Θ) | +$0.10/day | Net positive theta. The body short calls decay faster than the wing long calls. |
| Vega (ν) | +$0.45 per 1% IV | Mild long vega. An IV expansion benefits the structure more than the body's IV crush hurts it. |
| Rho (ρ) | +$0.20 per 1% rate | Mild long rates. |
Numbers computed at entry spot $212.40, 548 DTE, IV surface anchored at entry IV, r=4.5%, no dividend yield. Per-contract = per-share × 100.
Expected Move (1 Standard Deviation)
The 548-day 1σ move is ±$57.25 (±26.95% from spot). The lower breakeven at $223.18 is $10.78 above spot (+5.08%) — roughly 0.19σ above spot. The upper breakeven is undefined (plateau replaces it); the 290 level of RSP #1's upper breakeven sits roughly 1.30σ above spot.
| Window | ±1σ Move | % of Spot |
|---|---|---|
| 1 day | $2.45 | 1.15% |
| 1 week | $6.47 | 3.05% |
| 30 days | $13.39 | 6.31% |
| 90 days | $23.20 | 10.92% |
| 1 year | $46.72 | 22.00% |
| 548 days (full DTE) | $57.25 | 26.95% |
Intraday Setup (entry)
- Pre-market context: Same regime as RSP #1 — RSP closed Jul 21 at $212.76, 30-day realized vol ~11.7% annualized. The 548-DTE LEAP chain was wide across all four strikes. Spot at 12:55 PM ET was $212.40, down $0.05 from the RSP #1 fill.
- Entry signal: The vol surface priced the 285C wing at only $1.175 vs $1.075 for the 290C — a $0.10/share difference buying $5 of additional upper coverage. The asymmetric structure emerged from the live chain, not from the trade plan. When the upper wing is this cheap relative to the body premium, the short-upper condor strictly dominates the symmetric version.
- Execution: Limit order at $3.175 debit (OptionStrat basis). Filled 12:55 PM ET. Estimated actual fill $3.20–$3.25 debit. Recorded basis $3.175.
- Position size check: $317.50 max loss = 0.106% of $300k book. Combined with RSP #1, the pair risks $635 total (0.212% of book) for a combined max profit of $1,365.
Management Plan
- Open through Q4 2026 (~100 DTE remaining): Hold. The asymmetric wing costs nothing extra vs RSP #1, so the hold logic is identical.
- Q4 2026 → Q3 2027 (~100–300 DTE): If RSP closes above $287, the trade is on the $182.50 plateau — consider holding to expiry for the guaranteed floor rather than closing early. If RSP closes below $215 for two consecutive months, close for ~75% of debit.
- Q4 2027 (last 90 DTE): Take 50% of max profit ($341/contract) if in the profit zone. If on the upside plateau, hold to expiry.
- Stop loss: 2× debit ($635/contract cost to close) OR RSP closes below $205.
Position Update Log
| Date | RSP Price | Position Value | P&L | Notes |
|---|---|---|---|---|
| 2026-07-22 (entry) | $212.40 | $317.50 | — | Opened. 1 long call condor (short upper) @ $3.175 debit. IV ~22%. |
Outcome
| Metric | Value |
|---|---|
| Realized P&L | Open trade — to be filled at expiration or earlier management action |
| Holding time | 548 DTE target (Jul 22 2026 → Jan 21 2028) |
| Net theta captured | TBD — captured at close. |
| Remaining premium | TBD — the long 285C wing has value at expiry if RSP closes above $287. |
| Hit target? | Open — take 50% if profit ≥ $341/contract; hold plateau if above $287. |
Lessons
- What worked: The asymmetric structure was discovered in the live chain, not pre-planned — the 285C wing's $0.10/share cost delta vs the 290C made the short-upper condor a strictly better trade. Same debit, no upper max loss. The 8-minute gap between the two fills let the desk compare live quotes across both structures before committing.
- What I'd do differently: Open the asymmetric version first. The symmetric RSP #1 was the plan; RSP #2 was the improvement. In hindsight the tighter upper wing should have been the default given the flat-tape regime (a breakout above $290 was the least likely path). The pair is fine as a bracket, but the sequencing was backwards.
- Vol surface behavior: The upper wing's cheapness ($1.175 for 285C vs $2.20 for the 280C short) reflects the vol skew — upside calls on RSP LEAPs are priced for low tail risk. When the skew gives you a $5-wide upper body for $0.10/share, the structure menu should prefer the tighter wing.
- For the playbook: Add "short upper condor" as a named variant. The symmetric long call condor's upper max loss is a real cost in a melt-up regime. The asymmetric version eliminates it for pennies when the wing is cheap. The playbook's structure menu should check the upper wing width before defaulting to symmetric.
Cross-references
- RSP #1 — Jan 21 '28 220/230/280/290 long call condor (this journal, same day). The two trades shipped 8 minutes apart with the same debit; the comparison is built into the P/L chart above.
Disclosure
The desk may hold the positions, options, or underlyings mentioned in a trade-log entry at the time of publication; positions are disclosed in the trade-log entry itself. Nothing on this site is investment advice.
Disclaimer. This content is published for informational and educational purposes only. Nothing here is investment advice. Trading options involves substantial risk of loss and is not appropriate for every investor. Past performance, including the journal entries on this site, does not guarantee future results. You are solely responsible for your trading decisions.