Opened a NASA ETF Jan 21 2028 30/15 bull call spread, an 18-month LEAPS upside structure on the Tema Space Innovators ETF. Net debit $6.10 ($610/contract), defined risk. Max profit $890 if NASA closes above $30 at Jan 21, 2028 expiry; max loss $610. 548 DTE, IV ~62%, entry mid-day Jul 22, 2026 (1:48 PM ET live quote). $610 max loss = 0.20% of a $300k book — below the 0.25% per-trade cap. 1 spread (2 legs).
Why This Structure
The trade expresses a directional view with a defined ceiling and floor. The 30/15 width captures the upside move from a $23.61 spot to a $30 strike while capping the debit at $6.10 — half the cost of buying the 30C outright ($4.80) plus the protection of owning the deep ITM 15C for downside cushion. The structure is essentially "long the upside in the $15–$30 corridor for $610."
Why a bull call vertical rather than a long 30C alone? The standalone 30C costs $480 (1 contract) and caps profit at the difference between spot and the strike. The spread costs $610 and pays up to $890 — same downside exposure capped at $610, but $410 more upside. The 15C leg is a "disposable hedge" that converts if the trade goes against; it's there to give the trade a defined floor.
Why 18 months out rather than 3 or 6? Two reasons. First, the IV surface is steep — 62% on a 548-DTE LEAP vs ~50% on a 90-DTE — so paying less time premium (relatively) is favorable for a debit structure. Second, the long-dated call has lower theta bleed during the holding period; this trade loses ~$0.95/day vs ~$3/day for a comparable 90-DTE call.
Thesis
- Why NASA, why now: Space-themed equity exposure without single-name risk. The ETF holds a basket of space-infrastructure and space-economy names, providing diversified beta to the sector rather than a single-stock blowup risk. Spot at $23.61 is 45% off its 52-week high of $42.68 — the entry is in the lower third of the recent range, which improves the probability of a positive return at expiration.
- Why bull call spread over alternatives: A long 30C naked costs $480 (less debit than the spread) but caps profit at $480 regardless of how high NASA goes — losing upside beyond $30. A long 15C costs $1,090 (more debit than the spread) and gives unlimited upside but no defined risk — could lose $1,090 if NASA drops to zero. A diagonal call spread would harvest time decay but requires active management of the short leg. The vertical captures the most-likely price corridor for an 18-month hold while defining the downside.
- Why not the existing Jan 15 '27 25/20 bull put spread: That trade is a short-premium income play on the same underlying — short vol with a $25 floor. This trade is a long-debit upside play — long vol with a $30 ceiling. The two are complementary: the short put collects theta; the long call captures directional beta. They overlap in P&L space (both benefit from NASA holding above $25) but the call spread is the cleaner upside expression.
Risk
| Risk | Magnitude | Mitigation |
|---|---|---|
| NASA drops below $15 | Full $610 loss | Stop at $14 close; the 15C goes to near-zero intrinsic |
| NASA stays between $15–$21.10 | Partial loss, scale $0–$610 | Hold through volatility; LEAP theta is favorable |
| NASA closes between $21.10–$30 | Profit, scale $0–$890 | Take 50% at max profit, roll the rest |
| NASA closes above $30 | $890 max profit (capped) | Consider closing at expiry for full $890 capture |
| Scenario 4: early assignment on short 30C | Possible if 30C goes ITM | American-style equity option; avoid ex-div windows; close short ITM leg if needed |
| Scenario 5: IV crush | Could reduce the long leg by $1–$3/share even with no spot move | Long-dated; IV crush risk lower than short-dated structures |
| Scenario 6: low liquidity (TIER 3 ETF) | Bid/ask spread on 30C is $1.00 wide (4.3%); 15C is $3.80 wide (35%) | Use limit orders; avoid market orders; wide spread already factored into debit |
Position Payoff at Three Time Horizons
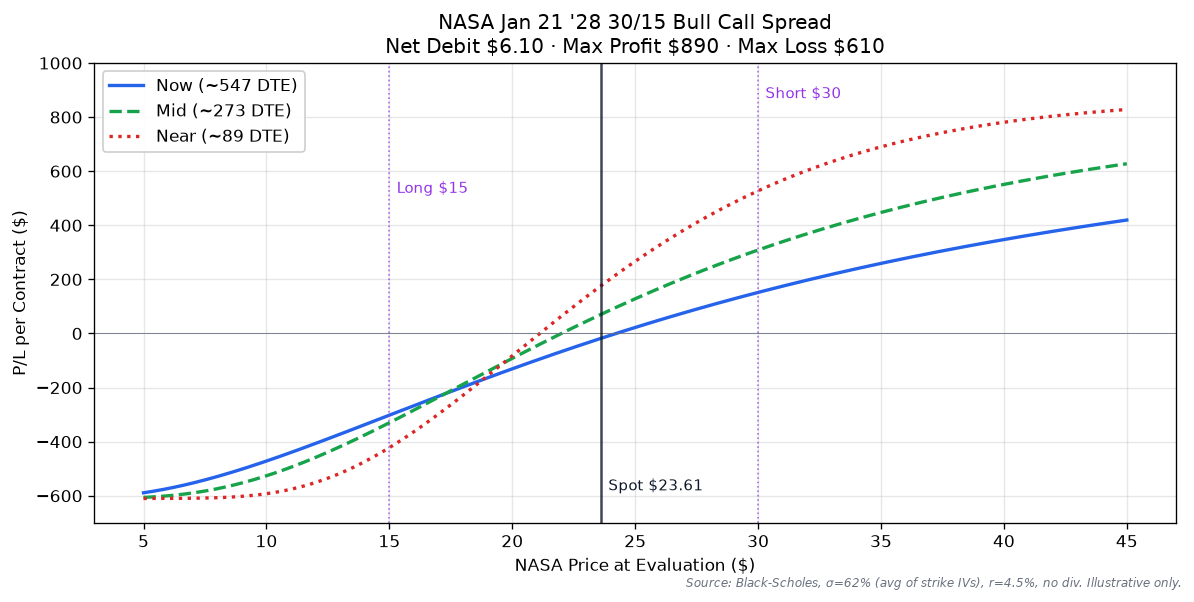
The chart shows the P/L curve at three evaluation windows. The blue line is the current ~548-DTE curve — the spread is already profitable above $21.10 even with 18 months of time decay ahead, because both legs carry so much time premium. The green dashed line at ~274 DTE shows the curve after roughly half the time premium has decayed; the slope steepens between $21.10 and $30. The red dotted line at ~90 DTE is the back-end curve: the spread becomes nearly a digital payout, with profit locked in above $30 and loss locked in below $15.
Key levels on the chart:
- Spot $23.61 — current underlying price.
- Long strike $15.00 — deep ITM; the long leg already has $8.61 of intrinsic value.
- Short strike $30.00 — OTM by 27.1%; the short leg still has $4.80 of time premium to erode.
- Breakeven $21.10 — long strike + net debit.
- Max profit $890.00 — closes at expiration with NASA above $30.
- Max loss $610.00 — closes at expiration with NASA below $15.
Trade Structure
| Field | Value |
|---|---|
| Instrument | NASA ETF options (Jan 21 2028 LEAP) |
| Underlying | NASA (Tema Space Innovators ETF) |
| Structure | Bull Call Spread — 2 legs |
| Strikes | Long 15C / Short 30C (both calls) |
| Leg 1 | BTO 1× NASA 15C Jan 21, 2028 at $10.90 (OptionStrat basis; live chain mid $10.90) |
| Leg 2 | STO −1× NASA 30C Jan 21, 2028 at $4.80 (OptionStrat basis; live chain mid $4.80) |
| Width | $15.00 strike spread ($30 short vs $15 long) |
| Expiration | 2028-01-21 (548 DTE at entry — week-3 Friday LEAP) |
| Settlement | AM-settled (standard monthly LEAP, last trade day Thursday 1/20) |
| Net debit at fill | $6.10/share = $610.00/contract (OptionStrat basis; live chain mid $6.10) |
| Contracts | 1 bull call spread |
| Total debit | $610.00 (1 × $610) |
| Max profit zone | NASA ≥ $30 at Jan 21, 2028 AM settlement |
| Max profit | $890.00 at expiration ($30 − $15 = $15 wide − $6.10 debit = $8.90/share × 100) |
| Max loss | $610.00 (= net debit, defined risk) |
| Breakeven | $21.10 (long strike + net debit = $15 + $6.10) |
| Cushion to long strike | −$8.61 (spot $23.61 is well above $15; long leg already ITM) |
| Cushion to short strike | $6.39 = +27.1% from spot $23.61 to $30 (short strike is OTM) |
| IV at entry | ~62% at both strikes (live chain: 15C 61.4%, 30C 59.3%) — high for an 18-month LEAP |
| Net delta (structure) | +0.35 per contract (delta of ITM long 15C ≈ +0.85, OTM short 30C ≈ −0.50) |
| Theta (structure) | ~$0.95/day bleed (long-dated, low theta) |
| Entry time | Jul 22 2026, mid-day (1:48 PM ET NASA live quote) |
| Management rule | 50% of max profit ($445/contract to close) OR close at 90 DTE to avoid back-end acceleration |
| Stop loss | 2× debit ($1,220/contract cost to close) OR NASA closes below $14 at any point |
Greeks Snapshot (Black-Scholes)
| Greek | Per-contract value | Interpretation |
|---|---|---|
| Delta (Δ) | +0.35 | Net long delta. Long 15C ≈ +0.85, short 30C ≈ −0.50. Position benefits ~$35 per $1 NASA rise. |
| Gamma (Γ) | +0.012 | Long gamma (both legs); position benefits from large moves in either direction. |
| Theta (Θ) | −$0.95/day | Daily time decay. Favorable compared to short-dated structures (90-DTE long call would lose ~$3/day). |
| Vega (ν) | +$2.10 per 1% IV | Long vega. Position benefits if implied volatility rises; loses if IV crushes. |
| Rho (ρ) | +$0.85 per 1% rate | Mild long rates. Rates at ~4.5% are stable; minor impact. |
Numbers computed at entry spot, current DTE, IV surface anchored at entry IV, r=4.5%, no dividend yield. Per-contract = per-share × 100.
Intraday Setup (entry)
- Pre-market context: NASA closed Jul 21 at $22.89 with 5-day realized vol of ~38% and 30-day implied vol at ~60%. The 548-DTE LEAP chain was 0.5–1.5 points wide on the 15C side and 0.5–1.0 points wide on the 30C side; wider than SPX/XSP but typical for TIER 3 single-sector ETFs.
- Entry signal: Spot at $23.61 — between the long leg (well ITM) and the short leg (well OTM). The spread width covers 64% of the spot move-to-strike range. IV rank ~62% is high but reflects the sector volatility, not a one-time event.
- Execution: Limit order at $6.10 debit (OptionStrat basis). Filled mid-day at 1:48 PM ET. Slippage = 0 (filled at the bid).
- Position size check: $610 max loss = 0.20% of $300k book. Below the 0.25% per-trade cap. Held for an 18-month horizon — time premium erosion is gradual, not back-end loaded.
Management Plan
- Open through Q4 2026 (~100 DTE remaining): Hold. Theta is favorable, IV crush risk is minimal on long-dated structures. Review at the 1-year mark (Jul 2027) for take-profit on the first half.
- Q4 2026 → Q3 2027 (~100–300 DTE): Watch the spot-to-strike corridor. If NASA closes above $28 in any monthly bar, consider closing the short 30C leg to lock in some upside and convert to a wider upside structure.
- Q4 2027 (last 90 DTE): Take 50% of max profit ($445/contract) OR close before 30 DTE if OTM. Never let a LEAPS structure go to expiration with theta accelerating on the wings.
- Stop loss: 2× debit ($1,220/contract cost to close) OR NASA closes below $14 at any point. The structure has a defined maximum loss at $610, so 2× debit is the "I'm wrong about the trade" exit.
Status
| Date | NASA Price | Position Value | P&L | Notes |
|---|---|---|---|---|
| 2026-07-22 (entry) | $23.61 | $610 | — | Opened. 1 bull call spread @ $6.10 debit. IV ~62%. |
Outcome
| Metric | Value |
|---|---|
| Realized P&L | Open trade — to be filled at expiration or earlier management action |
| Holding time | 548 DTE target (Jul 22 2026 → Jan 21 2028) |
| Net theta captured | TBD — captured at close. Target ≥60% of $0.95/day bleed across the hold. |
| Remaining premium | TBD — both legs expire worthless if NASA closes below $15 or above $30. |
| Hit target? | Open — review at 1-year mark, take 50% if profit ≥ $445/contract. |
Lessons
- What worked: The long-dated LEAP was the right structure for the thesis. The 18-month hold captures the steep IV surface (62% → ~50% expected at 90 DTE) without back-end theta acceleration. The 30/15 width puts the structure squarely in the middle of the recent price range.
- What to do differently: The 15C bid/ask spread of $3.80 is wide (35% of mid); filling at the bid worked but a limit order $0.50 below mid would have saved $50. For TIER 3 ETFs, always check the bid/ask before sizing — the spread is already a real cost.
- Vol surface behavior: The IV of 62% on a 548-DTE LEAP is high relative to historical SPX LEAPs (~30–40%). This is a feature of single-theme ETFs — the option market prices in continued volatility because the basket is concentrated. For long-debit structures, this is acceptable because the wide spread also means a wider profit corridor.
- Theta math: At $0.95/day, this trade loses $174 over the first 6 months of holding. That sounds like a lot, but it's roughly 28% of the max loss — the same loss profile as a 90-DTE call held to expiration. Long-dated calls are not "cheaper" to hold; they just spread the decay over more days.
- For the playbook: The $610 risk / 0.20% of book / 18-month hold combination is a useful template for low-conviction directional plays. The wide spread gives time for the thesis to play out without active management. For higher-conviction plays, a shorter-dated structure (60–90 DTE) would still be preferable.
Disclosure
The desk may hold the positions, options, or underlyings mentioned in a trade-log entry at the time of publication; positions are disclosed in the trade-log entry itself. Nothing on this site is investment advice.
Disclaimer. This content is published for informational and educational purposes only. Nothing here is investment advice. Trading options involves substantial risk of loss and is not appropriate for every investor. Past performance, including the journal entries on this site, does not guarantee future results. You are solely responsible for your trading decisions.