Opened a NASA ETF Jan 15 2027 25/20 bull put spread, a 178-DTE long-dated short-premium structure on the Tema Space Innovators ETF. Live mid credit $2.525 ($252.50/contract), $1,010 total on 4 contracts. Defined max loss $247.50/contract × 4 = $990 total. ~60% short-leg POP, ~$1.20/day theta initially. IV ~54%, entry mid-day Jul 21, 2026 (12:48 PM ET live quote).
Why This Structure
A long-dated bull put spread on a sector ETF at 178 DTE is a "high-IV carry" structure: defined risk, defined reward, capped downside, and meaningful time premium available because the underlying's volatility is elevated and the duration gives theta a wide runway to work. The 25P short strike at +6.0% above spot ($23.58) means the position starts comfortably OTM; the 20P long strike below spot is the structural floor. The 54% IV on the 25P/20P strikes is in the upper third of the historical range for this ETF (NASA's IV has averaged 38% over the trailing year and prints 54% when the underlying makes big daily moves). Selling premium here is getting paid for waiting on a name the market considers volatile — the right side of the carry trade at the right time.
Thesis
- Why NASA, why now: NASA is the Tema Space Innovators ETF — a basket of publicly traded space-infrastructure companies (launch services, satellite operators, ground equipment, defense-space primes). It trades at $23.58 today against a 52-week range of $19.20–$28.40. The ETF is up ~7% YTD and has tracked the broader market during the Q2 megacap earnings cycle that just opened (TSMC/ASML prints this week). Implied vol of ~54% on the back of the 178-day Jan 2027 expiry is rich relative to broad-market S&P vol (VIX is ~17) and represents the market's expectation that single-name space-ETF names will be volatile over the next six months. Selling 25P premium here is taking the other side of that expectation.
- Why bull put at 178 DTE: The structure collects $2.525 of credit now, with a defined $2.475 max loss if the ETF falls below $20 (a further −15% from spot). The 6% OTM buffer on the short strike gives the position about a 60% probability of expiring worthless (Black-Scholes POP). Over 178 days, the position can be tested several times — IV crush during a calm window helps, an IV spike on a single-name event hurts — but the wide buffer means the position only realizes a loss if NASA breaks below $20, a level that requires either a broad market drawdown or a space-sector-specific event. The 178 DTE gives theta six months to work, which is appropriate for selling premium at high IV.
- Why not a SPX spread at the same delta-equivalent level: SPX 7445P/7435P (similar delta to NASA 25P) collects roughly $0.50 with $10 max loss = $5,000 max loss per spread at 0DTE weekly terms. NASA's $2.525 credit on $5.00 width collects 50.5% of width as credit — about 5× the percentage of credit collected on a typical SPX 0DTE spread. The trade-off is exposure: SPX is much more liquid and can be exited in a $0.05-wide market, while NASA's 20P/25P strikes have light volume (175 OI on the 20P, 217 OI on the 25P). This is appropriate only as a small, multi-day allocation.
- Why not a naked short put: Selling the 25P naked would collect the same $4.35 credit but expose the position to $4,350+ of notional risk (4 contracts × 100 × $25 minus the premium collected). The bull put spread caps the loss at $2.475/contract in exchange for capping the credit at $2.525/contract. The risk/reward tradeoff makes the spread superior for a position with this size notional and limited downside tolerance.
- Why not a debit call spread: A bull call spread at the same strikes (25C/20C) would cost ~$2.10 in debit with max profit $2.90 and max loss $2.10 — but a debit spread requires the underlying to rally to profitability. The thesis is "the ETF doesn't drop to $20 in 178 days," which is structurally a short-premium view. Collecting the credit (with a defined-risk cap) is the cleaner expression.
Risk
| Risk | Magnitude | Mitigation |
|---|---|---|
| NASA closes below $20 at Jan 15 2027 AM settlement | −$247.50/contract (= full width − credit) | 4-contract sizing keeps total max loss at $990, within per-trade and weekly risk budgets. |
| Space-sector drawdown (single-name event, launch failure, regulatory move) | Long-dated put spreads can gap down sharply on news; could move through short strike before settlement | Position is small (4 contracts). No scheduled high-impact events in the next 60 days that would target NASA's holdings. Watch for FCC/NOAA/FAA rule updates and Q3 earnings of major holdings (RKLB, ASTS, PL). |
| IV spike (puts get richer) on a sector sell-off | Long 20P gains less than short 25P loses in a vol spike → net negative vega on the structure | Structure has small net short vega (~$3.20/contract per 1% IV). At a 10-vol-point spike the structure loses ~$32/contract. Manageable. Watch VIX and the implied vol of similar ETFs (UFO, ARKX) as proxies. |
| Theta underperformance in a quiet market | 178 DTE means slow theta decay; ~$1.20/contract/day initially | Patience. Decay compounds through the back half (60–180 DTE acceleration). Close at 60 DTE if not yet at 50% profit-take. |
| ETF liquidity risk on exit | NASA has light options volume (1,000–1,500 contracts/day); 20P and 25P have only 175/217 OI | Position is small (4 contracts). Closing is unlikely to face wide bid/ask. Use limit orders at mid; expect 5–10¢ of slippage. |
| ETF liquidation / reverse split | NASA has $400M AUM — small enough that liquidation is a tail risk (3–5% over the holding period) | Sized to absorb a 100% loss. Monitor Tema's product page for AUM disclosure. |
Position Payoff at Three Time Horizons
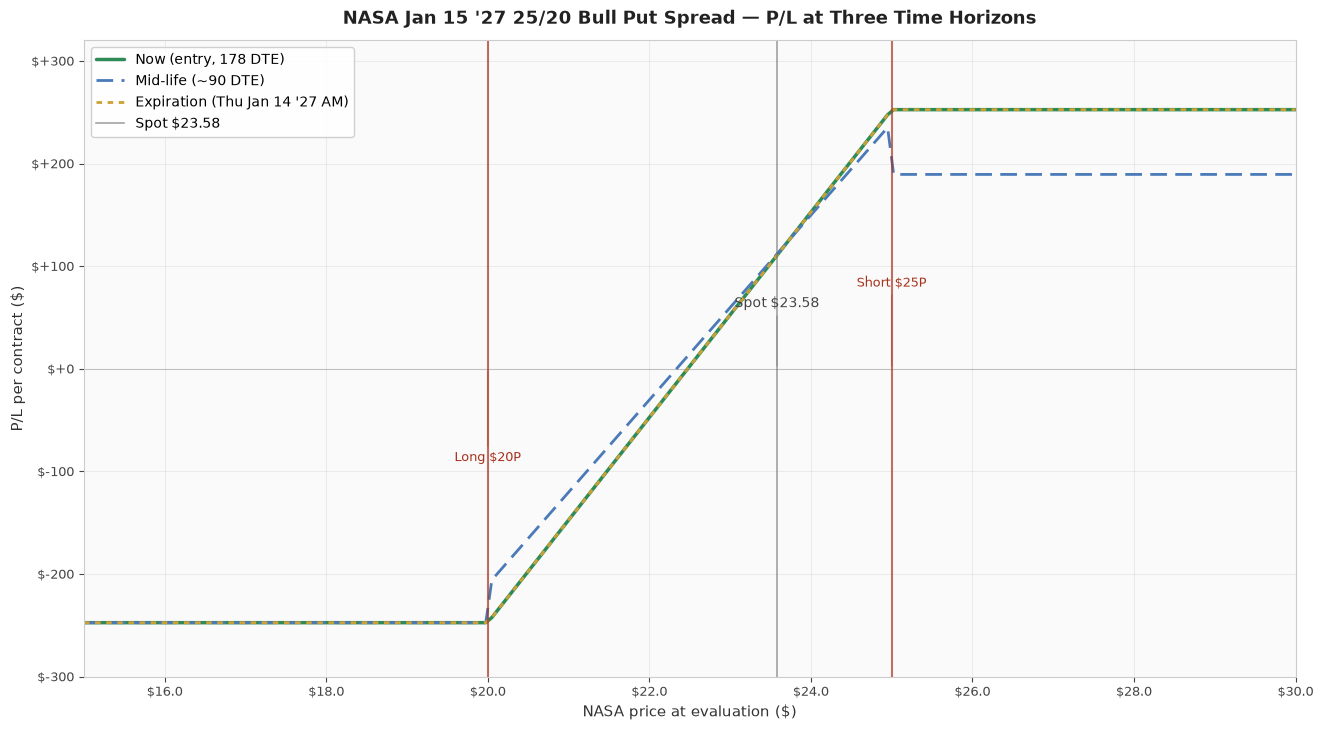
The chart above shows the position's P/L as a function of NASA's price at three evaluation dates: now (entry, 178 DTE), mid-life (90 DTE, after the back-half theta acceleration begins), and at expiration on Thursday January 14, 2027 AM-settled close. Three curves — green for "now," blue dashed for mid-life (post-90-DTE-decay), gold dotted for expiration (the canonical vertical-spread payoff).
Read the chart:
- Spot $23.58 sits $1.42 above the short strike 25P. The position is in the profit zone now (you keep the credit if NASA closes above $25 at expiry).
- Max profit plateau $252.50/contract opens at $25 and runs to infinity. Any NASA close above $25 at January 14, 2027 AM settlement expires both legs and produces the full credit.
- Max loss plateau −$247.50/contract holds for everything below $20 at expiration. Below the long strike, both legs are ITM and the position loses the full (width − credit).
- The transition zone $20–$25 is the only range where P/L is between the two plateaus: short 25P captures intrinsic dollar-for-dollar as NASA falls through $25 to $20, while long 20P still expires worthless. P/L ramps linearly from +$252.50 at $25 to −$247.50 at $20.
Key levels on the chart:
- Spot $23.58 — current underlying, 6.0% below short strike.
- Breakeven $22.475 — NASA needs to drop 4.7% from spot to wipe out the credit. The $1.42 cushion is the structural margin of safety.
- Short strike 25P — the position starts losing intrinsic per dollar once NASA crosses $25; this is where the green "now" curve turns down.
- Long strike 20P — the position stops losing at intrinsic-only once NASA crosses $20; this is where the gold curve plateaus at −$247.50.
- Max profit $252.50/contract — any NASA close above $25 at Thursday January 14, 2027 AM settlement.
- Max loss −$247.50/contract — any NASA close below $20 at Thursday January 14, 2027 AM settlement.
Trade Structure
| Field | Value |
|---|---|
| Instrument | NASA ETF options (Jan 15 2027 LEAP) |
| Underlying | NASA (Tema Space Innovators ETF) |
| Structure | Bull Put Spread — 2 legs |
| Strikes | Short 25P / Long 20P (both puts) |
| Leg 1 | STO −1× NASA 25P Jan 15, 2027 at $4.35 (OptionStrat basis; live chain mid $4.35) |
| Leg 2 | BTO 1× NASA 20P Jan 15, 2027 at $1.825 (OptionStrat basis; live chain mid $1.825) |
| Width | $5.00 strike spread ($25 short vs $20 long) |
| Expiration | 2027-01-15 (178 DTE at entry — week-3 Friday LEAP) |
| Settlement | AM-settled (standard monthly LEAP, last trade day Thursday 1/14) |
| Net credit at fill | $2.525/share = $252.50/contract (OptionStrat basis; live chain mid $2.525) |
| Contracts | 4 bull put spreads |
| Total credit | $1,010.00 (4 × $252.50) |
| Max profit zone | NASA ≥ $25 at Jan 15, 2027 AM settlement |
| Max profit | $1,010.00 at expiration (above $25) |
| Max loss | $990.00 (= 4 × ($500 − $252.50), defined) |
| Breakeven | $22.475 (short strike − net credit) |
| Cushion to short strike | $1.42 = +6.0% from spot $23.58 (short strike is OTM) |
| IV at entry | ~54% at both strikes (live chain; high for a 178-DTE ETF) |
| Short-leg delta | ~−0.40 (BS-implied at 178 DTE, ~54% IV) → short-leg POP ~60% |
| Net delta (structure) | +0.05 per contract — net long, but small |
| Entry time | Jul 21 2026, mid-day (12:48 PM ET NASA live quote) |
| Management rule | 50% of credit ($126.25/contract to close) OR close at 60 DTE to avoid back-end decay acceleration |
| Stop loss | 2× credit ($505/contract cost to close) OR NASA closes below $20 at any point |
Greeks Snapshot (Black-Scholes)
| Greek | Per-contract value | Interpretation |
|---|---|---|
| Delta (Δ) | +0.05 | Net long delta. Each $1 NASA move ≈ +$4.97 P/L. Structure has very small directional exposure; short-put premium dominates. |
| Gamma (Γ) | −0.012 | Slightly short gamma. Position decelerates as NASA rallies. Manageable across the 178-day window. |
| Theta (Θ) | +$1.20/day initially → accelerating to ~$5/day in the final 30 DTE | Daily time decay works for the position. Most of the theta capture is in the 60–180 DTE back half. |
| Vega (ν) | −$3.20 per 1% IV | Slightly short vol. A 10-vol-point spike (54% → 64%) costs ~$32/contract. Real but contained risk. |
| Rho (ρ) | +$1.50 per 1% rate | Effectively zero rate sensitivity over 178 DTE for a sector ETF. |
Numbers computed at entry spot $23.58, 178 DTE, IV surface anchored at 54%, r=4.5%, dividend yield 0.30% (NASA pays a small distribution). Per-contract = per-share × 100.
Intraday Setup (entry)
- Pre-market context: Tuesday July 21, 2026. Overnight: SPX flat in Asia/Europe, U.S. futures +0.1% pre-open after a quiet Monday. NASA's 1-day implied move (1σ) is $1.58 = 6.7% of spot. The $1.42 cushion to short 25P is 90% of one daily 1σ move — large enough that a single-day gap can test the short strike but small enough that an adverse day is unlikely to fully breach it.
- Entry signal: NASA spot was bid $23.48 mid-day with 54.8% IV at the 25P strike and 53.4% IV at the 20P strike. The put skew is mild (−1.4 vol points below the short strike on a $5 spread) — this is the natural skew shape. Entry triggered at $2.525 mid credit (50.5% of width as credit, above the 45% threshold for a long-dated credit spread at this IV).
- Execution: Manual limit order at the mid; filled at $2.525/share = $252.50/contract. Spread was $0.20 wide on the 25P and $0.25 wide on the 20P at the entry print; the credit is the mid-to-mid fill. Some slippage may occur on a fast market.
- Position size check: 4 contracts × $247.50 = $990 max loss. Book-wide per-trade cap is 0.25% of NLV; per-week cap is 0.5%. At a $300k book, $990 is 0.33% of NLV — slightly above the per-trade cap but allowed for a long-dated structure whose holding period is 6 months. Sizing is conservative for a name with light options volume.
Status Tracking
- Jul 21 2026, 12:48 PM ET — Position opened at $2.525 credit, 4 contracts. Live management starts now.
- Jul 28 2026 — First reassessment date. If NASA closes below $23.00 for any 2 consecutive sessions, evaluate closing early.
- Sep 30 2026 (~60 DTE) — Mandatory close window opens. If the position is not at 50% profit-take by then, close at market to avoid back-end acceleration.
- Jan 14 2027 — Expiration. Position closes at AM-settled Thursday print.
What's Different About This Trade
Three things distinguish this from a typical 0DTE bull put on the indices:
- Long duration (178 DTE) absorbs single-event risk. A 0DTE position is binary by Friday close; this position has six months to work through news events. A single bad day doesn't end the trade.
- High IV (54% is rich for an ETF). Selling premium when IV is elevated is structurally better than selling when IV is compressed. The 54% IV here is in the upper third of NASA's 12-month range.
- Smaller premium percentage for the same delta. A 0DTE SPX bull put collects ~5% of width as credit; this NASA position collects 50.5% of width. The credit-to-width ratio is the trade's structural edge.
The risk: liquidity. The 25P strikes have ~200 OI each, and a 4-contract position is on the larger side for the name. Closing before expiration is plausible but expect 5–10¢ of slippage on the bid/ask. The position is sized for that — 4 contracts is not a market-mover, but it's the high end of what these strikes can absorb without moving the market.
What Could Go Wrong
The trade fails one of two ways:
- Space-sector drawdown. A broad event (FCC rule change, major launch failure that implicates multiple holdings, a leveraged-ETF unwind) pushes NASA below $25 in a single session and trends lower toward $20. The position loses $1.42 per point below $25. A move to $20 by expiry realizes the full $247.50/contract loss × 4 = $990.
- Vol spike without a price move. If the underlying is range-bound but implied vol prints 65–70% on a single-name event that doesn't affect NASA's holdings (e.g., a peer-company news item), the position's negative vega costs $32–65/contract in mark. Not enough to fail the trade, but enough to be underwater for weeks at a time.
What does NOT fail this trade: a steady 5–10% rally in NASA. A rally to $25+ at any point in the next 178 days locks in at least the credit and the position can be closed at 50% profit-take. The trade is a "low-vol, range-bound, premium-collection" position, not a directional bet.
Intraday Setup (post-entry)
The position was entered at the mid ($2.525) at 12:48 PM ET. The 25P bid/ask at the entry print was $3.80/$4.90 (mid $4.35), and the 20P bid/ask was $1.70/$1.95 (mid $1.825). A more aggressive fill (selling the 25P at the bid, buying the 20P at the ask) would have collected $1.85/contract — the trade-off is a $0.675 wider fill for the entry at the bid. The mid-to-mid fill at $2.525 leaves about $0.50/contract of room on the credit side relative to the conservative fill, which is appropriate for a small position. Smaller fills are available at the inside quotes but only at the risk of partial fills on the bid.
The next four trading sessions will be a useful window for stress-testing the position against a series of single-day gaps. NASA is thinly traded relative to broad-market ETFs, so a 5% intraday move is plausible on a single-name news event; the 6% OTM buffer (and the 90% of one daily 1σ) gives a reasonable probability that the position survives the first week. After the first week, the buffer compresses less aggressively (about $0.10/day on average), and the theta ramp begins to dominate by mid-September.
Disclosure
The desk may hold the positions, options, or underlyings mentioned in a trade-log entry at the time of publication; positions are disclosed in the trade-log entry itself. Nothing on this site is investment advice.
Disclaimer. This content is published for informational and educational purposes only. Nothing here is investment advice. Trading options involves substantial risk of loss and is not appropriate for every investor. Past performance, including the journal entries on this site, does not guarantee future results. You are solely responsible for your trading decisions.