Opened a RUT long call diagonal: long 2900C Dec 31, 2026 (back month, lower strike) and short 2950C Dec 18, 2026 (front month, higher strike). Net debit $28.70/share ($2,870/contract). The structure's signature is the mid-life profit "hump" — max profit $4,849.08 at intermediate horizons (~125 DTE) with RUT in the 2,900–3,000 zone, falling back to a capped $2,130 at front expiration if RUT closes above $2,950. Max loss $2,870 (the debit). Entry April 24, 2026 mid-day; RUT $2,787.00, IV ~30% (tariff-shock regime). The position was sized as a single unit (1 diagonal, 2 legs) within the playbook's 0.25% NLV per-trade cap.
Why This Structure
A long call diagonal with strikes at 2900/2950 is a defined-risk, defined-reward debit position combining:
- A long back-month 2900C (262 DTE) at the lower strike
- A short front-month 2950C (249 DTE) at the higher strike
The strike spread ($50) is wider than the extra 13 days of time value on the back-month leg, which is what makes this a debit diagonal rather than a credit. The structure profits in a wide body above $2,900 — capped above $3,000, with max profit at intermediate horizons (not at expiration).
The 249–262 DTE structure is the key choice. Long-dated diagonals give theta time to work in your favor on the short strike while letting the long strike retain most of its extrinsic value for the first 90–120 days. After that, theta accelerates on the front-month short and the structure begins to flatten toward its expiration payoff.
The 2900-strike long leg is "close enough to behave like a leveraged long" if RUT rallies — so if the index moves well above $2,950 before Dec 18, the position captures near-full upside above the short strike. The 2950-strike short leg caps the upside at $2,950 minus the $50 strike spread (i.e., $2,900 effective long strike), but it also caps the maximum loss at the debit paid.
Thesis
- Why RUT, why now: Small-cap relative-value setup. RUT had been lagging the large-cap indices through Q1 2026 — the AI-led mega-cap rally was concentrated in the S&P 500, while small-caps traded sideways in the 2,400–2,800 range. April 24 was a tactical entry point after an 11.3% rally off the March 30 lows ($2,414 → $2,787), with RUT breaking back toward the upper end of the Q1 range near $2,800. RUT opened at $2,747.69 that day. The trade thesis: small-cap relative-value compression was due for a mean-reversion move higher, and a defined-risk long diagonal gave exposure to a sustained 5–10% RUT rally by year-end without undefined risk.
- Why a debit diagonal over alternatives: vs. a naked long 2950C Dec 31 (~$190/contract) — cheaper on the naked side, but the diagonal adds front-month theta harvest and a capped loss profile. vs. a same-expiration 2900/2950 bull call spread (~$15–20 debit) — cheaper, but caps profit at the $50 spread width with no time-value differential to exploit; the diagonal's hump profit ($4,849 vs $2,130 at expiration) is the payoff for the extra debit. vs. a same-strike calendar — a calendar at 2900 would have similar theta dynamics but no defined profit zone or clean breakeven; the 50-point strike spread creates both. vs. a credit diagonal — a credit diagonal profits from time decay only, not direction; the thesis here was directional (bullish on small-caps), so the debit diagonal was the right structure.
- Entry mechanics: Two separate legs, filled as limit orders mid-day: the long 2900C Dec 31 (262 DTE) at ~$213 and the short 2950C Dec 18 (249 DTE) at ~$188. Net debit $28.70 across the $50 strike spread.
Risk
| Risk | Magnitude | Mitigation |
|---|---|---|
| RUT below $2,900 at Dec 18 | Max loss = $2,870 (debit) | Defined risk. Stop at 2× debit ($5,740) if the position moves adversely. |
| RUT above $3,000 by mid-summer | Profit capped near max ($4,849) | Take profit on the hump. Don't hold into theta decay on the long leg. |
| IV crush on the long 2900C | Loss of extrinsic value over time | Expected — that's why the front-month short was sold. Theta on the short > theta on the long until ~60 DTE. |
| Early assignment on short 2950C | Possible if RUT dividends declared or ex-date near | RUT is an index — no dividends. Risk only on settlement if deep ITM at Dec 18. |
| RUT sells off >20% to $2,100 | Both legs deep OTM, full loss of debit | Acceptable — defined risk. Position size within the playbook's 0.25% NLV cap. |
Management Plan
- Open through month 3 (Jul 2026): Do nothing. Theta on the short leg is positive; the long leg is holding time value. Position is "in the zone" — let it work.
- Month 3–4 (Aug–Sep 2026): Begin watching delta. If RUT is in the 2,900–3,000 zone, the position is approaching max profit and the front-month theta is accelerating.
- Month 4–5 (Oct–Nov 2026): Take 50% of max profit OR close before 30 DTE if any leg is far OTM (the short will be near-zero).
- Stop loss: 2× debit paid ($5,740), OR close at 30 DTE if the trade has not entered the profit zone. Never let a long diagonal go to expiration with theta accelerating on both legs.
Position Payoff at Three Time Horizons
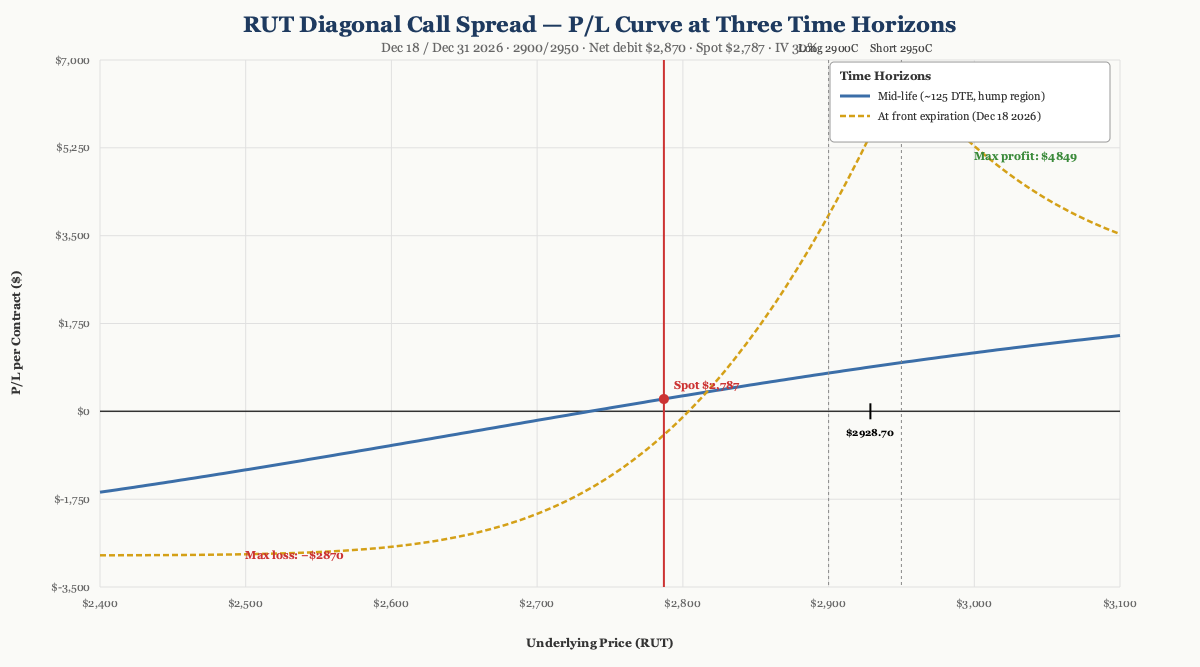
The chart shows the position's P/L as a function of RUT's price at three evaluation dates: at entry (the trade just opened), at mid-life (~125 DTE, halfway between entry and front expiration), and at front expiration (Dec 18, 2026 — when the short leg expires).
Read the chart:
- Spot $2,787 is below the lower breakeven of $2,928.70 — the position is in a small loss at entry. RUT needs to rally ~5% by Dec 18 for the trade to print.
- The mid-life hump in the 2,900–3,000 zone is the "theta harvest window" — close to optimal to take profit there at intermediate time. At ~125 DTE, the long 2900C still has substantial time value remaining (~137 days left) while the short 2950C has shed most of its time premium. That asymmetric decay produces the hump: max profit $4,849 at intermediate horizons.
- The at-expiration curve is the diagonal's terminal shape: capped profit of $50 − debit = $21.30 ($2,130/contract) for any RUT close above $2,950 at Dec 18, and a loss zone from $0 up to the lower breakeven at $2,928.70. Below $2,900 the position is at max loss (both legs expire worthless or deep OTM).
- Risk is fully defined: the max loss is the $2,870 debit, regardless of how low RUT goes.
Verification
The legs were filled as separate limit orders mid-day: long 2900C Dec 31 (262 DTE) at ~$213, short 2950C Dec 18 (249 DTE) at ~$188, for a net debit of $28.70. No independent chain verification (e.g., live yfinance mids) was disclosed in the source; the figures above are as recorded in the trade log at entry.
Sourcing and methodology
- Greeks — Black-Scholes at entry spot $2,787.00, IV surface anchored at 30%, risk-free rate 4.5%, no dividend yield; long leg 262 DTE, short leg 249 DTE; values per-contract (×100 shares). Net delta +3.32, gamma −0.001, theta +$0.06/day, vega +$30.82 per 1% IV, rho +$80.18 per 1% rate. Near-zero gamma and theta at entry are diagnostic of the diagonal — the two legs offset until DTE decay separates them.
- Payoff chart — generated with OptionStrat (plain-text reference; the source page linked its interactive builder).
- 30-day pre-entry move — RUT rallied from ~$2,503 in mid-March to $2,787 by April 24 (+11.3%), with the strategy premium expanding from $1,739 to $2,979/contract over the same window.
Position Update Log
| Date | RUT Price | Position Value | P&L | Notes |
|---|---|---|---|---|
| 2026-04-24 (entry) | $2,787.00 | $2,870 debit | — | Opened. IV ~30%. Long 2900C Dec 31 + short 2950C Dec 18. |
| 2026-07-14 | $2,964.76 | ~$3,700 | ~+$830 (+29%) | RUT has rallied 6.4% in 81 days. Position is solidly in profit. |
RUT rallied from $2,787 at entry to $2,965 as of July 14 — a 6.4% move that has put the trade into profit territory well ahead of the Dec 18 front expiration. The long 2900C Dec 31 has $64.76 of intrinsic value plus remaining time premium; the short 2950C Dec 18 is slightly ITM ($14.76 intrinsic) with ~5 months of time value left. Modeled position value (Black-Scholes, IV 22–30%, r = 4.5%): ~$3,670–3,730 per contract, P/L +$800–865 (+28–30% of debit). The hump profit ($4,849) is achievable if RUT continues into the 2,900–3,000 zone at intermediate horizons (Aug–Oct 2026) and is closed then. Management decision pending at the update: take 50% profit at the hump region, or hold for full max profit if RUT extends higher into Q4. Status at the update: open.
Lessons recorded in the source
The 249–262 DTE diagonal structure proved a useful addition to the standard playbook: it expresses a directional bullish view with defined risk and has the hump-profit potential at intermediate horizons that a same-expiration bull call spread can't offer. The key tradeoff is the higher debit ($2,870 vs ~$1,500 for a same-expiration 2900/2950 spread) in exchange for the additional upside at intermediate times. Theta math confirmed the entry thesis: approximately flat at entry (legs offset), meaningful daily gains in the Aug–Oct window, peak harvest by ~30 DTE on the short (mid-November).
Disclosure
The desk may hold the positions, options, or underlyings mentioned in a trade-log entry at the time of publication; positions are disclosed in the trade-log entry itself. Nothing on this site is investment advice.
Disclaimer. This content is published for informational and educational purposes only. Nothing here is investment advice. Trading options involves substantial risk of loss and is not appropriate for every investor. Past performance, including the journal entries on this site, does not guarantee future results. You are solely responsible for your trading decisions.