Opened a RUT Dec 18 2026 2700/2750 long call vertical spread (249 DTE), a defined-risk debit structure expressing a bullish small-cap view into the mid-Q2 rebound. Net debit $22.67/share ($2,267.00/contract). Max profit $2,733.01/contract at RUT ≥ $2,750; max loss $2,266.99. Breakeven $2,722.67. RUT spot at entry $2,670.49, IV ~30% (elevated, tariff-shock regime). Modeled probability of profit ~47% (BSM, 30% IV, 249 DTE). Risk/reward 1.00:1.21.
Why This Structure
A long call vertical spread on RUT at 2700/2750 is a tactical breakout entry with bounded risk. RUT had been consolidating in a 6-week range between roughly $2,414 (Mar 30 low) and $2,548 (Apr 7 high); on Apr 8–13 the index broke out to the upside, gaining ~5% in 5 trading days. This position was opened into the breakout, expressing the view that the move extends.
A naked long call would have given unlimited upside but exposed the position to full premium risk if the breakout failed. The vertical spread caps profit at $2,733 (above $2,750) but limits loss to the $2,267 debit, so a failed breakout costs the trade but doesn't blow up the position.
The vol surface was bid: RUT IV was running ~30% — elevated for the index, reflecting tariff and macro uncertainty. With 8 months to expiration, IV = 30% on a $50-wide spread gives roughly 45% of the spread width as debit, which is in the typical 40–50% range for short-duration verticals on high-IV underlyings.
Skew efficiency: a $50-wide spread on a $2,670 underlying is ~1.9% of spot. For a vertical on a high-priced index like RUT, this is a tight-enough band to capture a meaningful move but wide enough to give the trade room to work without requiring an exact target.
Thesis
- Why RUT, why now: RUT closed at $2,670.49 on April 13, 2026, with IV around 30% — elevated even for the index, which routinely trades in the 18–25% IV range in calm conditions. The April tariff announcement cycle had pushed realized vol higher, and the 30% IV reflected ongoing uncertainty. The setup had been on the watchlist since the Mar 30 lows. RUT had bounced 10.6% off the lows ($2,414 → $2,670) over 10 trading days and was testing the upper end of the Q1 trading range near $2,650. The thesis: small-cap relative-value compression was due for a mean-reversion move higher, and a defined-risk vertical gave exposure to a 5–8% RUT rally by year-end without undefined risk.
- Why a vertical spread over alternatives: A naked long 2700C gives unlimited upside but undefined (full-premium) downside if the breakout reverses. A wider vertical would demand a larger rally to reach the profit zone; a tighter vertical would pay a richer debit per point of width. The 2700/2750 band matches the observed breakout range (2,414–2,548 consolidation, now breaking above 2,670) with a breakeven only ~2% above spot.
- Why Dec 18, 2026 (249 DTE): The thesis is multi-month — the post-tariff-shock recovery in small-caps plays out over Q2–Q4, not a single event window. Long-dated legs also keep the net Greeks nearly flat (theta and gamma cancel across the tight strikes), making this a near-pure directional position with defined risk.
Risk
| Risk | Magnitude | Mitigation |
|---|---|---|
| Breakout fails; RUT closes below $2,722.67 at Dec 18 expiry | Loss of debit; max loss $2,266.99/contract | Defined risk. Stop at 2× debit OR close before 30 DTE if any leg is far OTM. |
| RUT closes between $2,722.67 and $2,750 at expiry | Partial profit, $0–$2,733 | Hold; intrinsic on the long leg recovers the debit above breakeven. |
| IV expands further (tariff escalation) | Net vega −10.69/contract per 1% IV — a 5-point IV spike costs ~$55/contract | Manageable at 30% IV; position is near-delta-only with minimal vega exposure. |
| Position stays OTM into the final 30 DTE | Accelerating relative decay on the long leg | Management rule: close before last 30 DTE if OTM; never let a debit vertical ride to expiry worthless without an exit plan. |
| RUT rallies past $2,750 early | Profit capped at $2,733; forgoes upside above the short strike | Acceptable by design — this is a "high-probability, capped-payoff" structure. Take 50% of max profit (~$1,367) if offered. |
Position Payoff at Three Time Horizons
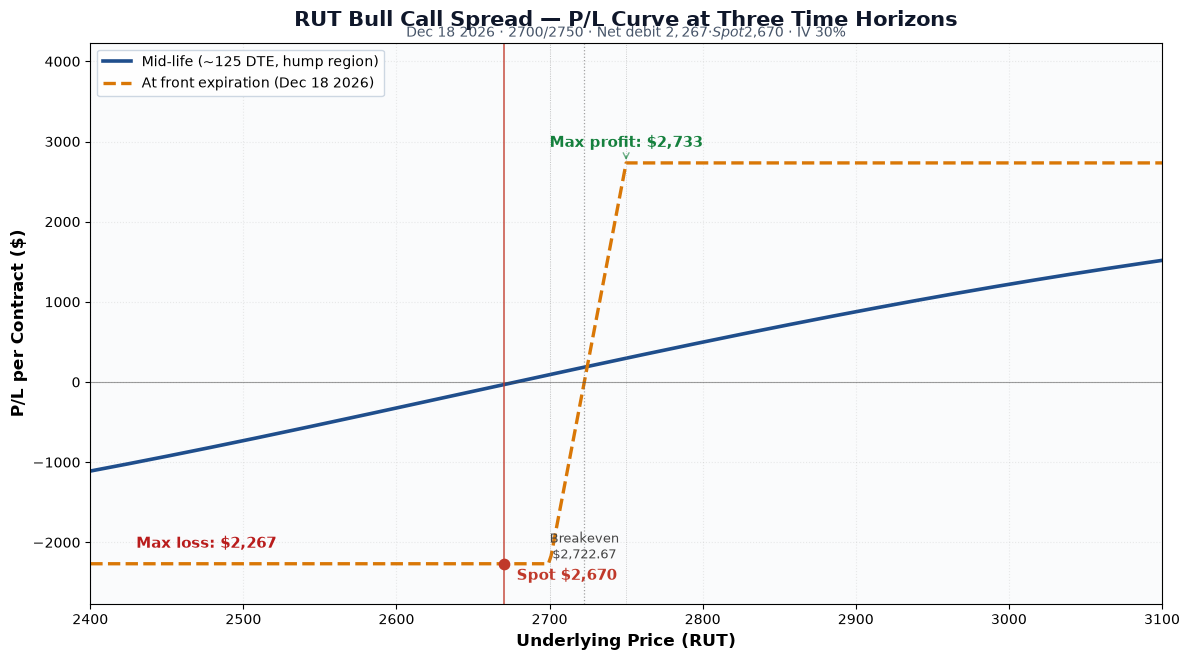
The P/L chart shows the position at three evaluation dates: at entry, at mid-life, and at expiration. Two curves — the mid-life curve and the at-expiration curve — tell the textbook vertical-spread story: capped upside, capped downside.
Read the chart:
- Spot $2,670 sits below the $2,700 long strike — the spread is in the loss zone at entry. The trade needs a ~2% rally to reach the $2,722.67 breakeven and a ~6% rally to print max profit above $2,750.
- Max profit $2,733.01/contract for any RUT close ≥ $2,750 at Dec 18, 2026. A plateau, not a point — every close above the short strike pays the same.
- Max loss $2,266.99/contract for any RUT close below $2,700 at expiry (both legs expire worthless).
- The transition zone $2,700–$2,750 is a linear ramp: the position goes from max loss at the long strike to max profit at the short strike, with zero P/L at the $2,722.67 breakeven.
- The mid-life curve sits above the expiration curve outside the spread band (the long leg retains time value), which is where the early-exit opportunity lives: closing before expiry recovers premium that decays to zero at the wings.
Verification
Leg prices were not separately disclosed in the source; the structure is recorded as entered at a net debit of $22.67/share ($2,267.00/contract) for 1 long call vertical spread. Greeks were computed per-contract at entry spot $2,670.49, IV 30%, r 4.5%, 249 DTE on both legs: net delta +2.91, net gamma −0.00073, net theta −0.04/day, net vega −10.69 per 1% IV, net rho +37.60 per 1% rate. The near-zero net gamma and theta are diagnostic of a tight vertical spread — the long and short legs cancel, leaving a near-pure directional exposure with bounded risk.
Sourcing and methodology
- Greeks — Black-Scholes at entry spot $2,670.49, IV surface anchored at 30%, risk-free rate 4.5%, no dividend yield, 249 DTE on both legs; values per-contract (×100 shares).
- PoP — BSM with 30% IV, 249 DTE: ~47%.
- Payoff chart — generated with OptionStrat (plain-text reference; the source page linked its interactive builder).
- 30-day pre-entry move — RUT dipped from ~$2,636 in early March to the $2,414 low on Mar 30, then broke out; the strategy premium bottomed at $1,535/contract on Mar 30 and recovered to $2,267 at entry in tandem with spot.
Position Update Log
| Date | RUT Price | Position Value | P&L | Notes |
|---|---|---|---|---|
| 2026-04-13 (entry) | $2,670.49 | $2,267 debit | — | Opened. IV ~30%. Long 2700C Dec 18 / short 2750C Dec 18. RUT breaking out of 6-week range. |
| 2026-07-14 | $2,964.76 | ~$3,265 | ~+$998 (+44%) | RUT has rallied 11% in 3 months. Long leg deep ITM ($264.76 intrinsic), short leg ITM ($214.76 intrinsic). Position capturing ~36% of max-profit potential. |
RUT rallied well past the spread's $2,723 breakeven and is approaching the $2,750 short strike (1.7% away at the update). Decision pending at the update: take profits early on the current rally (50% rule = ~$1,367), or let the trade run to expiry for the full $2,733? With 5 months of time value left to give back, an early exit at the ~$998 mark offers the better risk-adjusted outcome. Status at the update: open.
Disclosure
The desk may hold the positions, options, or underlyings mentioned in a trade-log entry at the time of publication; positions are disclosed in the trade-log entry itself. Nothing on this site is investment advice.
Disclaimer. This content is published for informational and educational purposes only. Nothing here is investment advice. Trading options involves substantial risk of loss and is not appropriate for every investor. Past performance, including the journal entries on this site, does not guarantee future results. You are solely responsible for your trading decisions.